Note
Go to the end to download the full example code or to run this example in your browser via JupyterLite.
Vine, Matthews and Morley’s magnetic stripes (1963)#
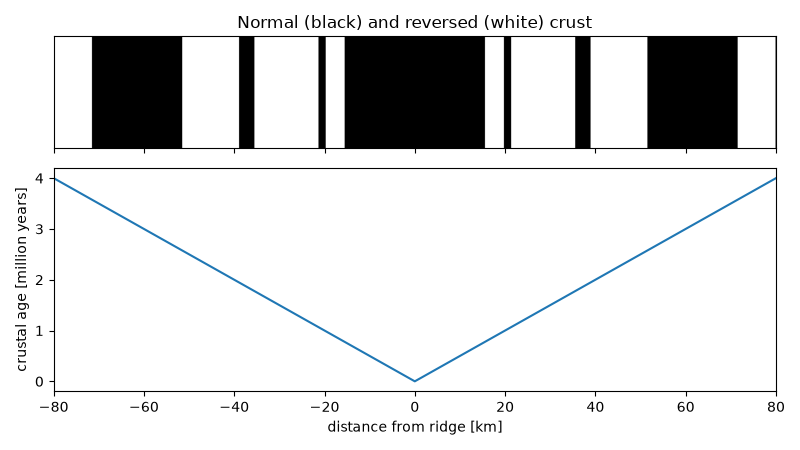
Fred Vine and Drummond Matthews, and independently Lawrence Morley, saw that ocean crust records the reversing geomagnetic field as it cools at the ridge. Distance over half-spreading rate gives the age of each stripe, so the pattern is a mirror image about the ridge. The polarity timescale below keeps only the main chrons and subchrons of the last 4 million years.
import matplotlib.pyplot as plt
import numpy as np

from earthsciencekit.plate_tectonics import spreading_age
from earthsciencekit.units import convert

# Boundaries of alternating polarity, normal first [million years].
boundaries = np.array([0.0, 0.78, 0.99, 1.07, 1.78, 1.95, 2.58, 3.58, 4.0])
half = convert(2.0, "cm/year", "m/s")
distance = np.linspace(-80e3, 80e3, 1601)
age = convert(spreading_age(np.abs(distance), half), "s", "year") / 1e6
polarity = np.where(np.searchsorted(boundaries, age, side="right") % 2 == 1, 1, -1)
np.testing.assert_array_equal(polarity, polarity[::-1])
brunhes = spreading_age(15.6e3, half)
assert np.isclose(convert(brunhes, "s", "year"), 0.78e6)

fig, (top, bottom) = plt.subplots(2, 1, sharex=True, figsize=(8, 4.5), height_ratios=[1, 2])
top.imshow(polarity[None, :], aspect="auto", cmap="gray_r", extent=[-80, 80, 0, 1])
top.set(yticks=[], title="Normal (black) and reversed (white) crust")
bottom.plot(distance / 1e3, age)
bottom.set(xlabel="distance from ridge [km]", ylabel="crustal age [million years]")
fig.tight_layout()

plt.show()
Total running time of the script: (0 minutes 0.128 seconds)
