Note
Go to the end to download the full example code or to run this example in your browser via JupyterLite.
Sherman’s unit hydrograph (1932)#
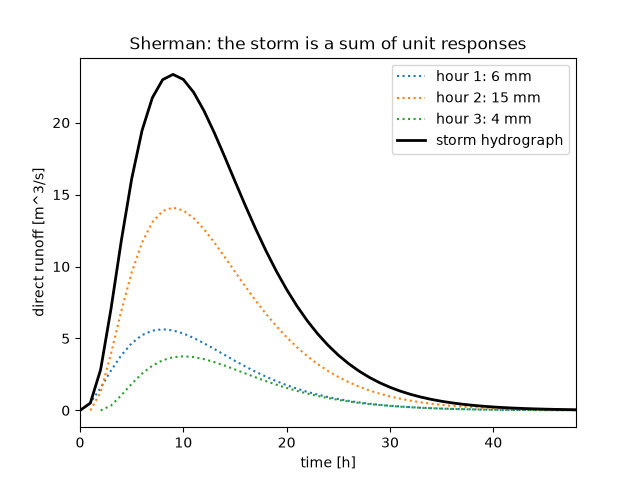
LeRoy Sherman proposed that a catchment responds linearly to rain: one centimetre of excess rainfall in a given interval always produces the same hydrograph, and a storm produces the sum of these responses, shifted and scaled by its bursts of rain. The example takes a Nash (1957) cascade of reservoirs as the unit hydrograph of a 50 km^2 catchment, convolves it with a three-hour storm, and checks that the flood carries the volume of the excess rain.
import matplotlib.pyplot as plt
import numpy as np

from earthsciencekit.hydrology import nash_unit_hydrograph, unit_hydrograph_convolution

area, step = 50e6, 3600.0
hours = np.arange(72)
unit = area * nash_unit_hydrograph(hours * step, 3, 4 * step)  # m^3/s per metre of excess rain
storm = np.array([0.006, 0.015, 0.004])  # m of excess rain per hour
flood = unit_hydrograph_convolution(storm, unit)
assert np.isclose(flood.sum() * step, storm.sum() * area, rtol=1e-2)

fig, ax = plt.subplots()
for i, burst in enumerate(storm):
    ax.plot(hours + i, burst * unit, ":", label=f"hour {i + 1}: {burst * 1e3:g} mm")
ax.plot(np.arange(flood.size), flood, "k", lw=2, label="storm hydrograph")
ax.set(xlim=(0, 48), xlabel="time [h]", ylabel="direct runoff [m^3/s]", title="Sherman: the storm is a sum of unit responses")
ax.legend()

plt.show()
Total running time of the script: (0 minutes 0.080 seconds)
