Note
Go to the end to download the full example code or to run this example in your browser via JupyterLite.
Aki’s seismic moment (1966)#
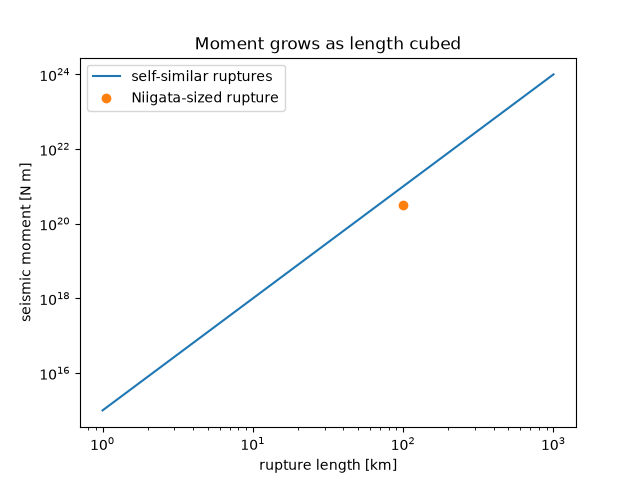
From the long-period Love waves of the 1964 Niigata earthquake, Keiiti Aki measured the seismic moment, rigidity times fault area times average slip. Unlike magnitudes read off one instrument, moment is a physical quantity that does not saturate for great earthquakes. The fault dimensions below are of the order Aki inferred (about 100 km by 20 km, a few metres of slip).
moment of order 3.2e+20 N m
import matplotlib.pyplot as plt
import numpy as np

from earthsciencekit.seismology import seismic_moment

rigidity = 4e10
niigata = seismic_moment(rigidity, 100e3 * 20e3, 4.0)
assert 1e20 < niigata < 1e21
print(f"moment of order {niigata:.1e} N m")

# Self-similar ruptures: width is half the length and slip grows with length.
length = np.logspace(3, 6, 100)
moment = seismic_moment(rigidity, length * length / 2, 5e-5 * length)
np.testing.assert_allclose(np.diff(np.log10(moment)) / np.diff(np.log10(length)), 3)

fig, ax = plt.subplots()
ax.loglog(length / 1e3, moment, label="self-similar ruptures")
ax.loglog(100, niigata, "o", label="Niigata-sized rupture")
ax.set(xlabel="rupture length [km]", ylabel="seismic moment [N m]", title="Moment grows as length cubed")
ax.legend()

plt.show()
Total running time of the script: (0 minutes 0.151 seconds)
