Note
Go to the end to download the full example code or to run this example in your browser via JupyterLite.
Arrhenius’s sensitivity to CO2 (1896)#
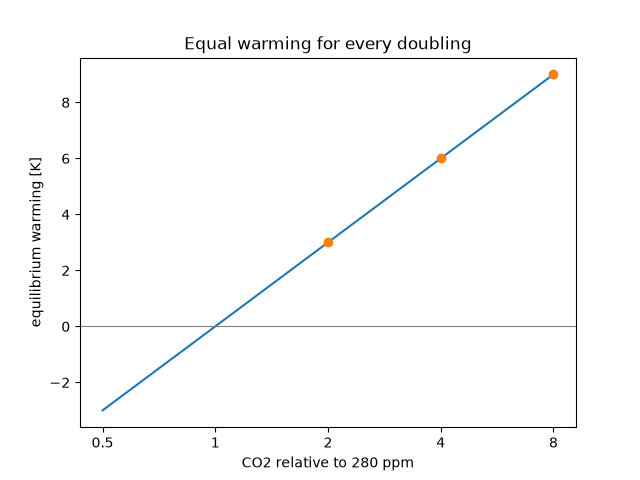
Svante Arrhenius calculated by hand how the surface temperature would change if the carbon dioxide in the air were multiplied or divided. He found that the warming grows with the logarithm of the concentration, so every doubling adds the same amount; his estimate was 5 to 6 °C per doubling. With a logarithmic forcing and a linear feedback, each doubling here adds 3 K.
import matplotlib.pyplot as plt
import numpy as np

from earthsciencekit.climate import co2_forcing, equilibrium_warming

restoring = 5.35 * np.log(2) / 3.0
ratio = np.geomspace(0.5, 8, 200)
warming = equilibrium_warming(co2_forcing(280 * ratio, 280, 5.35), restoring)
per_doubling = equilibrium_warming(co2_forcing(280 * np.array([2, 4, 8]), 280, 5.35), restoring)
np.testing.assert_allclose(np.diff(per_doubling), 3.0)
assert np.isclose(per_doubling[0], 3.0)

fig, ax = plt.subplots()
ax.semilogx(ratio, warming)
ax.semilogx([2, 4, 8], per_doubling, "o")
ax.set_xticks([0.5, 1, 2, 4, 8], ["0.5", "1", "2", "4", "8"])
ax.minorticks_off()
ax.axhline(0, color="0.5", lw=0.8)
ax.set(xlabel="CO2 relative to 280 ppm", ylabel="equilibrium warming [K]", title="Equal warming for every doubling")

plt.show()
Total running time of the script: (0 minutes 0.065 seconds)
