Note
Go to the end to download the full example code or to run this example in your browser via JupyterLite.
McKenzie and Parker’s plates on a sphere (1967)#
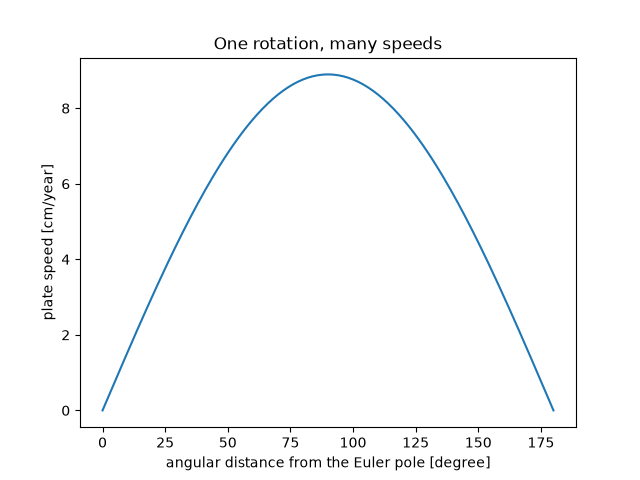
Dan McKenzie and Robert Parker showed that the North Pacific moves as one rigid cap rotating about a single pole. Speed then varies as the sine of the angular distance from the pole: zero at the pole, largest 90 degrees away.
import matplotlib.pyplot as plt
import numpy as np

from earthsciencekit.constants import EARTH_RADIUS
from earthsciencekit.plate_tectonics import plate_speed
from earthsciencekit.units import convert

omega = convert(0.8, "degree", "rad") / convert(1e6, "year", "s")
distance = np.linspace(0, np.pi, 181)
speed = plate_speed(omega, EARTH_RADIUS, distance)
assert np.isclose(float(plate_speed(omega, EARTH_RADIUS, 0)), 0)
assert np.argmax(speed) == 90 and np.isclose(speed.max(), omega * EARTH_RADIUS)

fig, ax = plt.subplots()
ax.plot(np.rad2deg(distance), convert(speed, "m/s", "cm/year"))
ax.set(xlabel="angular distance from the Euler pole [degree]", ylabel="plate speed [cm/year]")
ax.set_title("One rotation, many speeds")

plt.show()
Total running time of the script: (0 minutes 0.070 seconds)
