Note
Go to the end to download the full example code or to run this example in your browser via JupyterLite.
Jamieson’s glacial isostasy (1865)#
Thomas Jamieson explained the raised beaches of Scotland, now far above the sea, by the weight of the ice sheet that once covered the country: the land sank under the ice and has risen since it melted. In equilibrium the mantle gives way until the displaced rock weighs as much as the ice, so the bed sinks by the ice thickness times the density ratio, about 0.28.
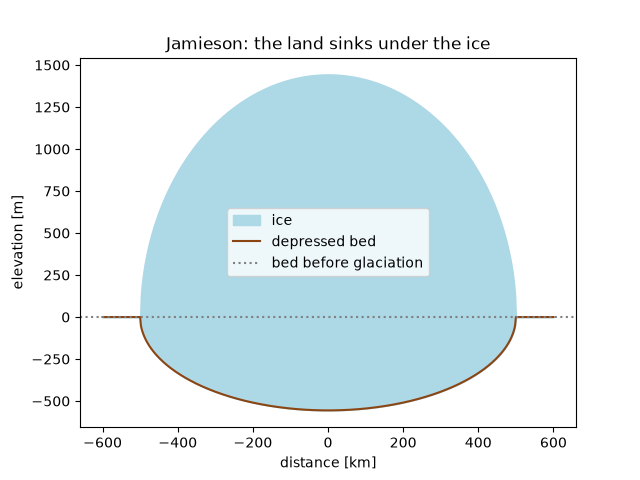
import matplotlib.pyplot as plt
import numpy as np

from earthsciencekit.constants import ICE_DENSITY
from earthsciencekit.glaciology import isostatic_depression

mantle_density = 3300.0
distance = np.linspace(-600e3, 600e3, 601)
ice = 2000.0 * np.sqrt(np.clip(1 - (distance / 500e3) ** 2, 0, None))
depression = isostatic_depression(ice, ICE_DENSITY, mantle_density)
assert np.isclose(depression.max(), 2000 * ICE_DENSITY / mantle_density)

fig, ax = plt.subplots()
ax.fill_between(distance / 1e3, -depression, ice - depression, color="lightblue", label="ice")
ax.plot(distance / 1e3, -depression, color="saddlebrown", label="depressed bed")
ax.axhline(0, color="0.5", ls=":", label="bed before glaciation")
ax.set(xlabel="distance [km]", ylabel="elevation [m]", title="Jamieson: the land sinks under the ice")
ax.legend()

plt.show()
Total running time of the script: (0 minutes 0.095 seconds)
