Note
Go to the end to download the full example code or to run this example in your browser via JupyterLite.
Runcorn’s apparent polar wander (1956)#
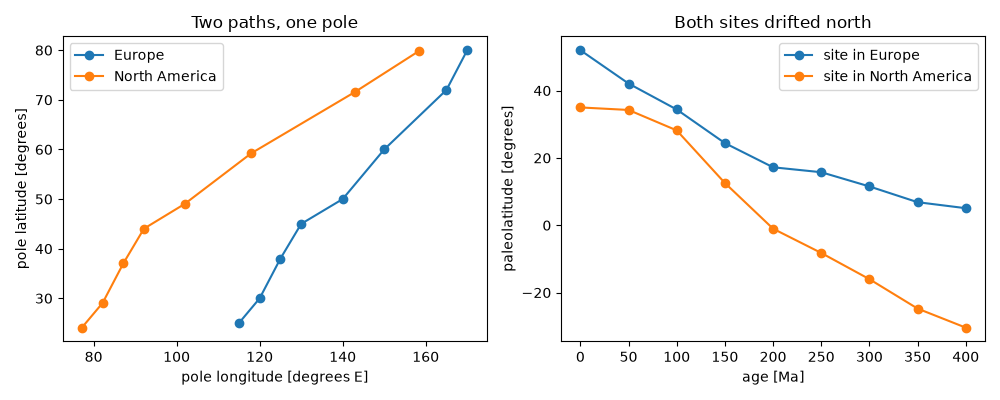
Keith Runcorn and his colleagues turned the directions in old rocks into virtual geomagnetic poles. British rocks gave poles that wandered far from the present pole with age. When Runcorn added North American rocks, their path ran parallel to the European one but about 30 degrees to the west. One pole cannot be in two places, so the continents must have moved apart: closing the Atlantic brings the two paths together. This example builds synthetic paths in that way and recovers them from site directions.
import matplotlib.pyplot as plt
import numpy as np

from earthsciencekit.geophysics import paleolatitude, virtual_geomagnetic_pole
from earthsciencekit.units import convert


def unit(lat, lon):
    return np.stack([np.cos(lat) * np.cos(lon), np.cos(lat) * np.sin(lon), np.sin(lat)], axis=-1)


def rotate(vectors, axis, angle):
    angle = np.asarray(angle)[..., None]
    return vectors * np.cos(angle) + np.cross(axis, vectors) * np.sin(angle) + axis * (vectors @ axis)[..., None] * (1 - np.cos(angle))


def site_direction(site_lat, site_lon, pole_lat, pole_lon):
    dlon = pole_lon - site_lon
    p = np.arccos(np.sin(site_lat) * np.sin(pole_lat) + np.cos(site_lat) * np.cos(pole_lat) * np.cos(dlon))
    dec = np.arctan2(
        np.cos(pole_lat) * np.sin(dlon), np.cos(site_lat) * np.sin(pole_lat) - np.sin(site_lat) * np.cos(pole_lat) * np.cos(dlon)
    )
    return dec, np.arctan2(2 * np.cos(p), np.sin(p))


age = np.array([0, 50, 100, 150, 200, 250, 300, 350, 400])
europe = unit(np.radians([90, 80, 72, 60, 50, 45, 38, 30, 25]), np.radians([0, 170, 165, 150, 140, 130, 125, 120, 115]))
axis = unit(np.radians(88.5), np.radians(27.7))  # Bullard et al. (1965) fit of the Atlantic
opening = np.radians(-38.0) * np.minimum(age / 180, 1)
america = rotate(europe, axis, opening)
paths = {}
for name, vectors, site in [("Europe", europe, (52.0, -1.0)), ("North America", america, (35.0, -111.0))]:
    pole_lat, pole_lon = np.arcsin(vectors[:, 2]), np.arctan2(vectors[:, 1], vectors[:, 0])
    site_lat, site_lon = np.radians(site)
    dec, inc = site_direction(site_lat, site_lon, pole_lat, pole_lon)
    poles = virtual_geomagnetic_pole(site_lat, site_lon, dec, inc)
    np.testing.assert_allclose(unit(poles[:, 0], poles[:, 1]), vectors, atol=1e-12)
    paths[name] = (poles, paleolatitude(inc))
closed = rotate(unit(paths["North America"][0][:, 0], paths["North America"][0][:, 1]), axis, -opening)
np.testing.assert_allclose(closed, europe, atol=1e-12)

fig, (left, right) = plt.subplots(1, 2, figsize=(10, 4))
for name, (poles, latitudes) in paths.items():
    left.plot(convert(np.unwrap(poles[1:, 1]), "rad", "degree"), convert(poles[1:, 0], "rad", "degree"), "o-", label=name)
    right.plot(age, convert(latitudes, "rad", "degree"), "o-", label=f"site in {name}")
left.set(xlabel="pole longitude [degrees E]", ylabel="pole latitude [degrees]", title="Two paths, one pole")
left.legend()
right.set(xlabel="age [Ma]", ylabel="paleolatitude [degrees]", title="Both sites drifted north")
right.legend()
fig.tight_layout()

plt.show()
Total running time of the script: (0 minutes 0.213 seconds)
