Note
Go to the end to download the full example code or to run this example in your browser via JupyterLite.
Gerstner’s trochoidal wave (1802)#
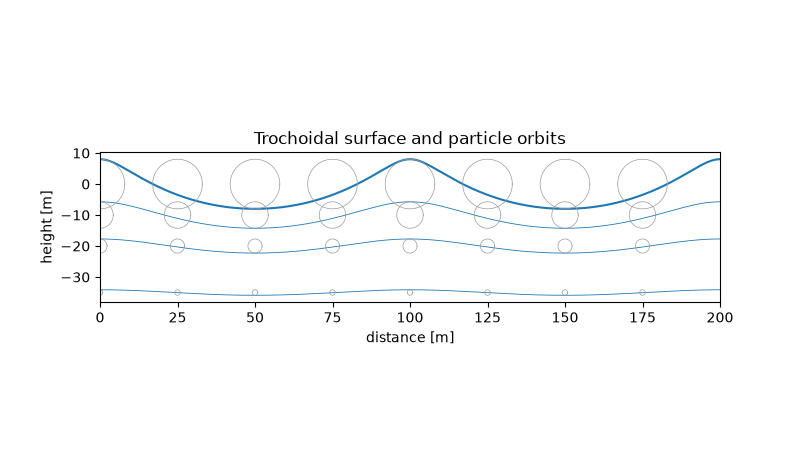
Franz Josef von Gerstner found the first exact nonlinear water wave. Each
particle moves on a circle whose radius shrinks as exp(-k b) with its
depth b, and the free surface is a trochoid with sharp crests and flat
troughs. Because the crests are narrow, the mean surface lies k a**2 / 2
below the level of the orbit centres. The wave travels at the deep-water speed
sqrt(g / k).
import matplotlib.pyplot as plt
import numpy as np

from earthsciencekit.constants import GRAVITY
from earthsciencekit.oceanography import deep_wave_speed, gerstner_orbit_radius

wavelength, amplitude = 100.0, 8.0
k = 2 * np.pi / wavelength
assert np.isclose(np.sqrt(GRAVITY / k), deep_wave_speed(wavelength, GRAVITY))


def surface(rest_x, depth, phase=0.0):
    radius = gerstner_orbit_radius(depth, amplitude, k)
    return rest_x - radius * np.sin(k * rest_x - phase), -depth + radius * np.cos(k * rest_x - phase)


rest = np.linspace(0, wavelength, 4001)
x, z = surface(rest, 0.0)
assert np.isclose(np.trapezoid(z, x) / wavelength, -k * amplitude**2 / 2, rtol=1e-6)

fig, ax = plt.subplots(figsize=(8, 4.5))
rest = np.linspace(-wavelength, 2 * wavelength, 6001)
for depth in [0, 10, 20, 35]:
    ax.plot(*surface(rest, depth), color="tab:blue", lw=1.5 if depth == 0 else 0.6)
theta = np.linspace(0, 2 * np.pi, 100)
for centre in np.arange(0, 2 * wavelength, wavelength / 4):
    for depth in [0, 10, 20, 35]:
        radius = gerstner_orbit_radius(depth, amplitude, k)
        ax.plot(centre + radius * np.cos(theta), -depth + radius * np.sin(theta), color="0.6", lw=0.5)
ax.set(xlim=(0, 2 * wavelength), xlabel="distance [m]", ylabel="height [m]", aspect="equal", title="Trochoidal surface and particle orbits")

plt.show()
Total running time of the script: (0 minutes 0.086 seconds)
