Note
Go to the end to download the full example code or to run this example in your browser via JupyterLite.
Weertman’s marine ice-sheet instability (1974)#
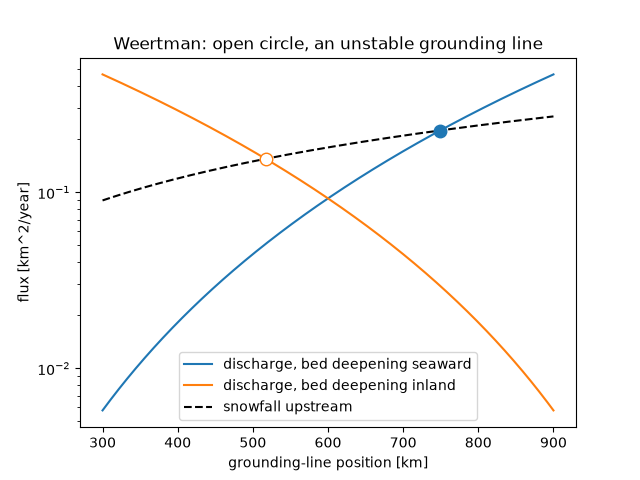
Johannes Weertman studied the junction between an ice sheet grounded below sea level and its floating shelf. The ice at the grounding line has the flotation thickness, set by the water depth, and the shelf spreads at a rate that rises as a power of that thickness. A grounding line on a bed that deepens inland therefore cannot be steady: a small retreat thickens the ice at the junction, which discharges more ice, which drives further retreat. The example compares the snowfall feeding the ice sheet with a measure of the discharge, the spreading of 10 km of cold shelf times the flotation thickness.
import matplotlib.pyplot as plt
import numpy as np

from earthsciencekit.constants import GRAVITY, ICE_DENSITY, SECONDS_PER_YEAR
from earthsciencekit.glaciology import flotation_thickness, ice_shelf_strain_rate

x = np.linspace(300e3, 900e3, 601)  # m, distance from the divide
accumulation = 0.3 / SECONDS_PER_YEAR
supply = accumulation * x
fig, ax = plt.subplots()
for label, depth, sign in [("bed deepening seaward", 300 + 1e-3 * (x - 300e3), 1), ("bed deepening inland", 900 - 1e-3 * (x - 300e3), -1)]:
    thickness = flotation_thickness(depth, ICE_DENSITY, 1028)
    discharge = ice_shelf_strain_rate(thickness, 1e-25, 3, ICE_DENSITY, 1028, GRAVITY) * 10e3 * thickness
    crossing = np.argmin(np.abs(discharge - supply))
    imbalance_slope = np.gradient(discharge - supply, x)[crossing]
    assert np.sign(imbalance_slope) == sign  # positive: advance raises discharge (stable)
    line = ax.semilogy(x / 1e3, discharge * SECONDS_PER_YEAR / 1e6, label=f"discharge, {label}")[0]
    face = "white" if sign < 0 else line.get_color()
    ax.plot(x[crossing] / 1e3, discharge[crossing] * SECONDS_PER_YEAR / 1e6, "o", ms=9, zorder=3, color=line.get_color(), mfc=face)
ax.plot(x / 1e3, supply * SECONDS_PER_YEAR / 1e6, "k--", label="snowfall upstream")
ax.set(xlabel="grounding-line position [km]", ylabel="flux [km^2/year]", title="Weertman: open circle, an unstable grounding line")
ax.legend()

plt.show()
Total running time of the script: (0 minutes 0.125 seconds)
