Note
Go to the end to download the full example code or to run this example in your browser via JupyterLite.
Teisserenc de Bort’s stratosphere (1902)#
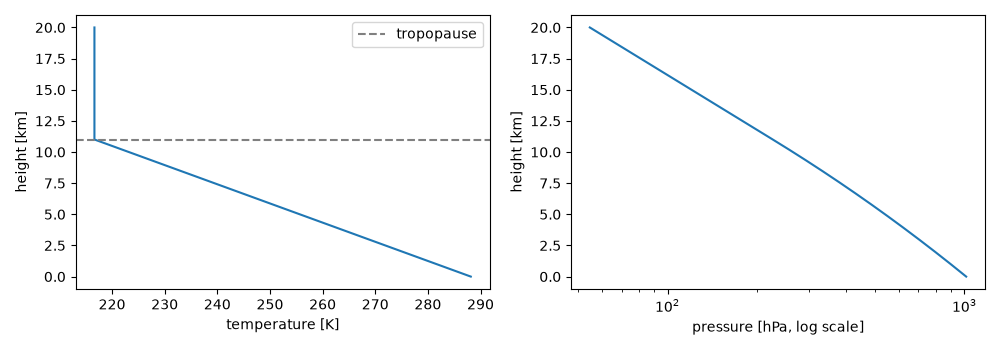
Léon Teisserenc de Bort launched hundreds of unmanned sounding balloons from Trappes. Above about 11 km the temperature stopped falling, a layer he called the stratosphere; Richard Assmann found the same in Berlin. With the standard lapse rate of 6.5 K/km below the tropopause, hydrostatic balance gives the standard-atmosphere pressure of 226.3 hPa at 11 km, and the pressure decays exponentially in the isothermal layer above.
import matplotlib.pyplot as plt
import numpy as np

from earthsciencekit.atmosphere import two_layer_temperature
from earthsciencekit.constants import GRAVITY, R_DRY_AIR

height = np.linspace(0, 20e3, 4001)
temperature = two_layer_temperature(height, 288.15, 0.0065, 11e3)
integrand = GRAVITY / (R_DRY_AIR * temperature)
log_pressure = np.concatenate([[0], np.cumsum((integrand[1:] + integrand[:-1]) / 2 * np.diff(height))])
pressure = 101325 * np.exp(-log_pressure)
lapse = -np.gradient(temperature, height)
assert abs(pressure[height == 11e3][0] - 22632) < 5
assert np.allclose(lapse[height > 11.1e3], 0) and np.allclose(lapse[height < 10.9e3], 0.0065)

fig, axes = plt.subplots(1, 2, figsize=(10, 3.5))
axes[0].plot(temperature, height / 1000)
axes[0].axhline(11, color="0.5", ls="--", label="tropopause")
axes[0].set(xlabel="temperature [K]", ylabel="height [km]")
axes[0].legend()
axes[1].semilogx(pressure / 100, height / 1000)
axes[1].set(xlabel="pressure [hPa, log scale]", ylabel="height [km]")
fig.tight_layout()

plt.show()
Total running time of the script: (0 minutes 0.200 seconds)
