Note
Go to the end to download the full example code or to run this example in your browser via JupyterLite.
Ekman’s spiral (1905)#
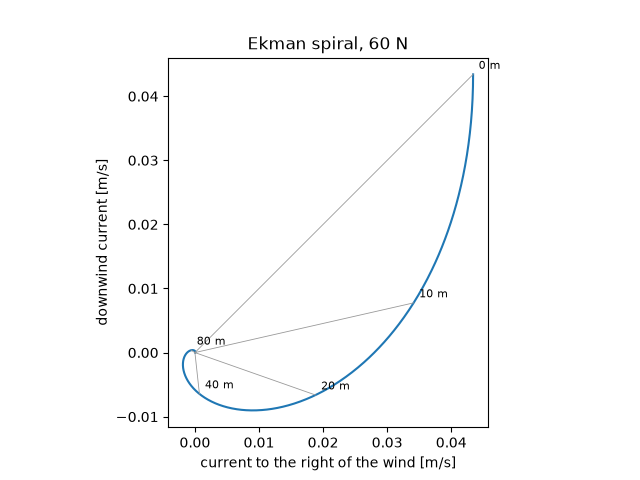
Nansen saw that drifting Arctic ice moved 20-40 degrees to the right of the wind. Ekman explained it: friction carries the wind’s stress down through a rotating ocean, and each layer drags the one below, turned further to the right and slower. The surface current is 45 degrees to the right of the wind, and the net transport is at right angles to it.
import matplotlib.pyplot as plt
import numpy as np

from earthsciencekit.atmosphere import coriolis_parameter
from earthsciencekit.oceanography import ekman_spiral_velocity, ekman_transport

stress, density, viscosity = 0.1, 1025, 0.02
f = coriolis_parameter(np.radians(60))
depth = np.linspace(0, 400, 4001)
velocity = ekman_spiral_velocity(depth, stress, density, viscosity, f)
assert np.isclose(np.degrees(np.arctan2(velocity[0, 1], velocity[0, 0])), 45)
assert np.isclose(np.trapezoid(velocity[:, 1], depth), ekman_transport(stress, density, f), rtol=1e-4)

fig, ax = plt.subplots()
ax.plot(velocity[:, 1], velocity[:, 0])
for z in [0, 10, 20, 40, 80]:
    i = np.searchsorted(depth, z)
    ax.annotate(f"{z} m", velocity[i, ::-1], textcoords="offset points", xytext=(4, 4), fontsize=8)
    ax.plot([0, velocity[i, 1]], [0, velocity[i, 0]], color="0.6", lw=0.6)
ax.set(xlabel="current to the right of the wind [m/s]", ylabel="downwind current [m/s]", aspect="equal", title="Ekman spiral, 60 N")

plt.show()
Total running time of the script: (0 minutes 0.077 seconds)
