Note
Go to the end to download the full example code or to run this example in your browser via JupyterLite.
Torricelli’s barometer (1643)#
Evangelista Torricelli filled a glass tube with mercury and upended it in a dish. The column fell to about 76 cm and left a vacuum above it: the weight of the air holds the mercury up. A water barometer needs a column 13.6 times taller, which is why pumps cannot lift water more than about 10 m.
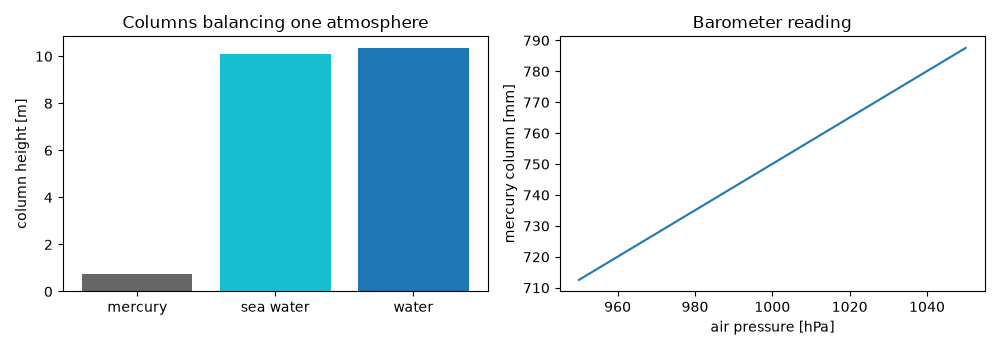
{'mercury': '0.760 m', 'sea water': '10.080 m', 'water': '10.333 m'}
import matplotlib.pyplot as plt
import numpy as np

from earthsciencekit.atmosphere import barometer_column_height
from earthsciencekit.constants import GRAVITY

liquids = {"mercury": 13595.1, "sea water": 1025.0, "water": 999.97}
heights = {name: float(barometer_column_height(101325, density, GRAVITY)) for name, density in liquids.items()}
assert abs(heights["mercury"] - 0.760) < 1e-3
assert np.isclose(heights["water"] / heights["mercury"], liquids["mercury"] / liquids["water"])
print({name: f"{h:.3f} m" for name, h in heights.items()})

pressure = np.linspace(95e3, 105e3, 101)
fig, axes = plt.subplots(1, 2, figsize=(10, 3.5))
axes[0].bar(list(heights), list(heights.values()), color=["0.4", "tab:cyan", "tab:blue"])
axes[0].set(ylabel="column height [m]", title="Columns balancing one atmosphere")
axes[1].plot(pressure / 100, barometer_column_height(pressure, liquids["mercury"], GRAVITY) * 1000)
axes[1].set(xlabel="air pressure [hPa]", ylabel="mercury column [mm]", title="Barometer reading")
fig.tight_layout()

plt.show()
Total running time of the script: (0 minutes 0.166 seconds)
