Note
Go to the end to download the full example code or to run this example in your browser via JupyterLite.
Morgan’s hotspot tracks (1971)#
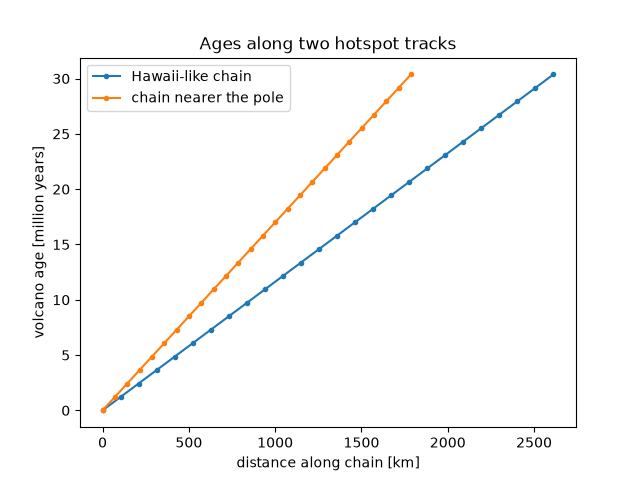
W. Jason Morgan proposed that fixed plumes rising from the deep mantle feed chains such as Hawaii-Emperor. A plate rotating over them leaves volcanoes whose age grows linearly along small circles about the plate’s Euler pole. Chains at different distances from the pole move at different speeds but record the same rotation. Positions and ages here are synthetic.
import matplotlib.pyplot as plt
import numpy as np

from earthsciencekit.constants import EARTH_RADIUS
from earthsciencekit.plate_tectonics import hotspot_age
from earthsciencekit.units import convert

omega = convert(convert(8.6, "cm/year", "m/s"), "m/s", "m/s") / (EARTH_RADIUS * np.sin(np.deg2rad(70)))
rotation = np.deg2rad(np.linspace(0, 25, 26))
fig, ax = plt.subplots()
ages = []
for colatitude, name in [(70, "Hawaii-like chain"), (40, "chain nearer the pole")]:
    length = rotation * EARTH_RADIUS * np.sin(np.deg2rad(colatitude))
    age = hotspot_age(length, omega, EARTH_RADIUS, np.deg2rad(colatitude))
    ages.append(age)
    ax.plot(length / 1e3, convert(age, "s", "year") / 1e6, "o-", ms=3, label=name)
np.testing.assert_allclose(ages[0], ages[1])
midway = hotspot_age(2.4e6, omega, EARTH_RADIUS, np.deg2rad(70))
assert np.isclose(convert(midway, "s", "year") / 1e6, 27.9, atol=0.1)
ax.set(xlabel="distance along chain [km]", ylabel="volcano age [million years]", title="Ages along two hotspot tracks")
ax.legend()

plt.show()
Total running time of the script: (0 minutes 0.083 seconds)
