Note
Go to the end to download the full example code or to run this example in your browser via JupyterLite.
Wilson’s transform faults (1965)#
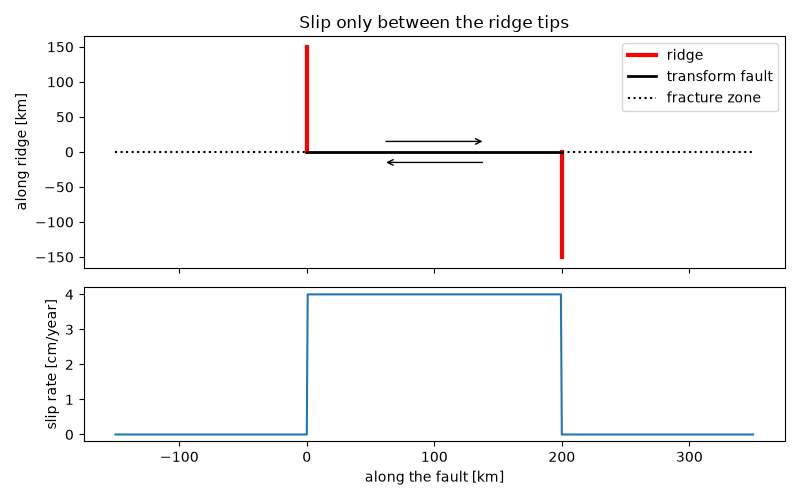
J. Tuzo Wilson recognised that the faults offsetting mid-ocean ridges slip only between the two ridge tips, and in the opposite sense to the apparent offset. There the boundary is parallel to the relative motion, so all of the full spreading rate is strike slip and none of it is convergence.
import matplotlib.pyplot as plt
import numpy as np

from earthsciencekit.plate_tectonics import convergence_rate, fault_slip_rate, full_spreading_rate
from earthsciencekit.units import convert

full = full_spreading_rate(convert(2.0, "cm/year", "m/s"))
offset = 200e3
x = np.linspace(-150e3, offset + 150e3, 701)
active = (x > 0) & (x < offset)
slip = np.where(active, fault_slip_rate(full, np.pi / 2), 0.0)
assert np.isclose(float(fault_slip_rate(full, np.pi / 2)), full)
assert abs(float(convergence_rate(full, np.pi / 2))) < 1e-12 * full

fig, (top, bottom) = plt.subplots(2, 1, sharex=True, figsize=(8, 5), height_ratios=[3, 2])
top.plot([0, 0], [0, 150], "r", lw=3, label="ridge")
top.plot([offset / 1e3] * 2, [-150, 0], "r", lw=3)
top.plot([0, offset / 1e3], [0, 0], "k", lw=2, label="transform fault")
top.plot([-150, 0], [0, 0], "k:", label="fracture zone")
top.plot([offset / 1e3, (offset + 150e3) / 1e3], [0, 0], "k:")
top.annotate("", (140, 15), (60, 15), arrowprops={"arrowstyle": "->"})
top.annotate("", (60, -15), (140, -15), arrowprops={"arrowstyle": "->"})
top.set(ylabel="along ridge [km]", title="Slip only between the ridge tips")
top.legend(loc="upper right")
bottom.plot(x / 1e3, convert(slip, "m/s", "cm/year"))
bottom.set(xlabel="along the fault [km]", ylabel="slip rate [cm/year]")
fig.tight_layout()

plt.show()
Total running time of the script: (0 minutes 0.166 seconds)
