Note
Go to the end to download the full example code or to run this example in your browser via JupyterLite.
Brunhes’s reversed magnetization (1906)#
Bernard Brunhes studied a lava flow at Pontfarein in the Massif Central and the clay it had baked as it flowed over it. Both were magnetized in the same direction, nearly opposite to today’s field: pointing south and up. The clay could only have taken its magnetization from the field as it cooled, so the field itself had pointed the other way. A reversed dipole at the site’s latitude of 45 degrees gives a declination of 180 degrees and an inclination of -63 degrees.
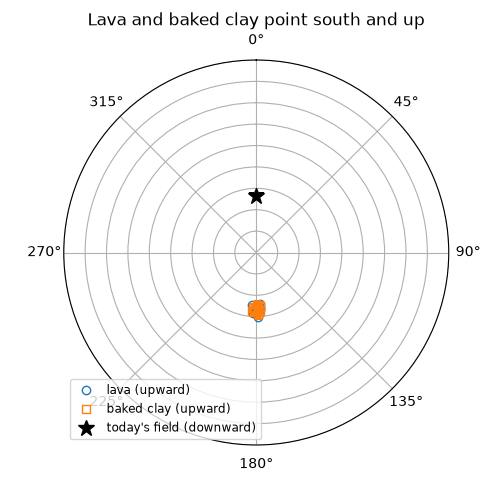
import matplotlib.pyplot as plt
import numpy as np

from earthsciencekit.geophysics import dipole_field, direction_angle, field_elements
from earthsciencekit.units import convert

latitude = np.radians(45.0)
normal = field_elements(*np.insert(dipole_field(latitude, 6.371e6, 8e22), 1, 0))
reversed_field = field_elements(*np.insert(dipole_field(latitude, 6.371e6, -8e22), 1, 0))
assert np.isclose(abs(reversed_field[0]), np.pi) and np.isclose(reversed_field[1], -normal[1])
assert np.isclose(convert(reversed_field[1], "rad", "degree"), -np.degrees(np.arctan(2)))

rng = np.random.default_rng(1906)
scatter = rng.normal(0, 0.04, size=(2, 12, 3))
samples = {}
for k, name in enumerate(["lava", "baked clay"]):
    vectors = np.insert(dipole_field(latitude, 6.371e6, -8e22), 1, 0) / 3e-5 + scatter[k]
    samples[name] = field_elements(vectors[:, 0], vectors[:, 1], vectors[:, 2])
    assert np.all(direction_angle(samples[name][:, 0], samples[name][:, 1], reversed_field[0], reversed_field[1]) < np.radians(10))

fig = plt.figure(figsize=(5, 5))
ax = fig.add_subplot(projection="polar")
ax.set_theta_zero_location("N")
ax.set_theta_direction(-1)
for name, marker in [("lava", "o"), ("baked clay", "s")]:
    ax.plot(samples[name][:, 0], 90 - np.abs(np.degrees(samples[name][:, 1])), marker, mfc="none", ls="", label=f"{name} (upward)")
ax.plot(normal[0], 90 - np.degrees(normal[1]), "k*", ms=12, label="today's field (downward)")
ax.set_rlim(0, 90)
ax.set_yticklabels([])
ax.set_title("Lava and baked clay point south and up")
ax.legend(loc="lower left", fontsize="small")

plt.show()
Total running time of the script: (0 minutes 0.101 seconds)
