Note
Go to the end to download the full example code or to run this example in your browser via JupyterLite.
Mogi’s point source (1958)#
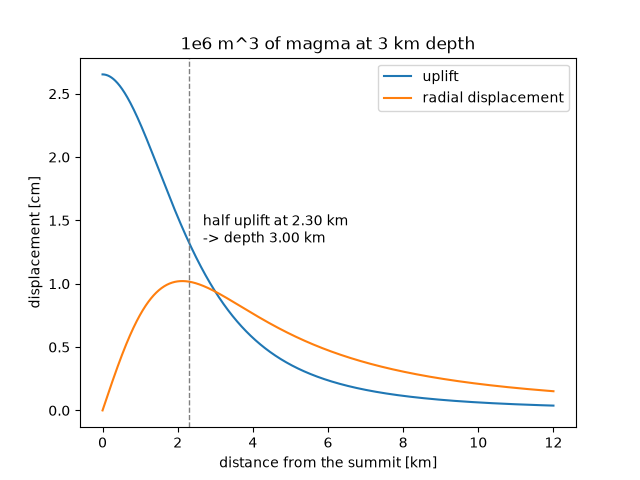
Kiyoo Mogi modelled a magma chamber as a small pressurized sphere in an elastic half-space and matched the domes of uplift that surveys measured around Sakurajima and Kilauea. The uplift is bell-shaped and halves at 0.766 times the source depth, so the width of a dome locates the chamber and its volume gives the magma added.
import matplotlib.pyplot as plt
import numpy as np

from earthsciencekit.volcanology import mogi_displacement

depth, volume, nu = 3000.0, 1e6, 0.25
distance = np.linspace(0, 12000, 1201)
radial, vertical = mogi_displacement(distance, depth, volume, nu).T
half_width = distance[np.argmin(np.abs(vertical - vertical[0] / 2))]
assert np.isclose(half_width / 0.766, depth, rtol=0.005)
assert np.isclose(distance[np.argmax(radial)], depth / np.sqrt(2), atol=10)

fig, ax = plt.subplots()
ax.plot(distance / 1e3, vertical * 100, label="uplift")
ax.plot(distance / 1e3, radial * 100, label="radial displacement")
ax.axvline(half_width / 1e3, color="0.5", ls="--", lw=1)
label = f"half uplift at {half_width / 1e3:.2f} km\n-> depth {half_width / 0.766 / 1e3:.2f} km"
ax.annotate(label, (half_width / 1e3, vertical[0] * 50), xytext=(10, 0), textcoords="offset points")
ax.set(xlabel="distance from the summit [km]", ylabel="displacement [cm]", title="1e6 m^3 of magma at 3 km depth")
ax.legend()

plt.show()
Total running time of the script: (0 minutes 0.089 seconds)
