Note
Go to the end to download the full example code or to run this example in your browser via JupyterLite.
Manabe and Wetherald’s radiative-convective equilibrium (1967)#
Syukuro Manabe and Richard Wetherald computed the temperature profile of a single atmospheric column in which radiation and convection balance. Where radiative equilibrium alone would be unstable, convection holds the temperature at a fixed lapse rate. With relative humidity held fixed, doubling CO2 warmed the surface by about 2.3 K. In this simplest version, the troposphere passes through the effective temperature at the emission height, and more CO2 lifts that height. The surface then warms by the lapse rate times the lift. The model keeps the stratosphere at a fixed skin temperature, so it misses the stratospheric cooling that Manabe and Wetherald also found.
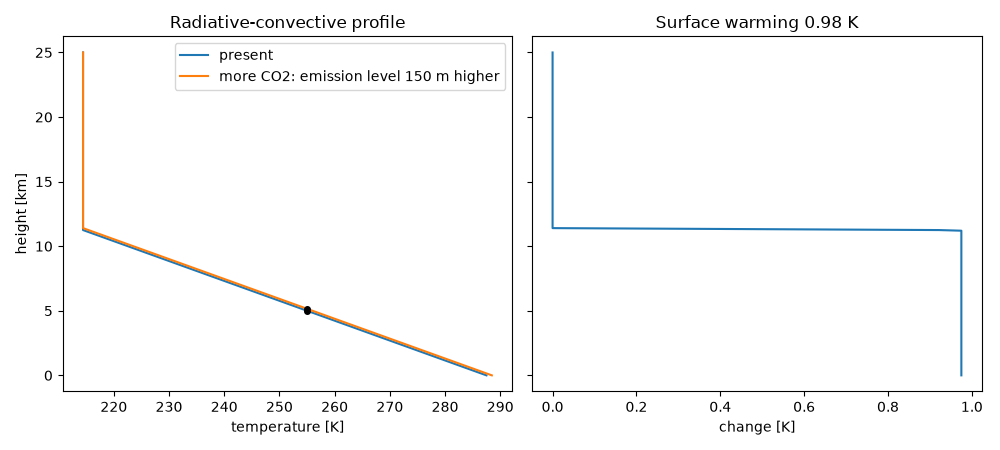
import matplotlib.pyplot as plt
import numpy as np

from earthsciencekit.climate import radiative_convective_temperature

height = np.linspace(0, 25e3, 501)
effective, lapse = 255.0, 6.5e-3
profiles = []
fig, (left, right) = plt.subplots(1, 2, figsize=(10, 4.5), sharey=True)
for emission, label in [(5.0e3, "present"), (5.15e3, "more CO2: emission level 150 m higher")]:
    profiles.append(radiative_convective_temperature(height, effective, lapse, emission))
    assert np.isclose(radiative_convective_temperature(emission, effective, lapse, emission), effective)
    left.plot(profiles[-1], height / 1e3, label=label)
    left.plot(effective, emission / 1e3, "ko", ms=4)
warming = profiles[1] - profiles[0]
assert np.isclose(warming[0], lapse * 150)
np.testing.assert_allclose(profiles[0][-1], effective / 2**0.25)
right.plot(warming, height / 1e3)
left.set(xlabel="temperature [K]", ylabel="height [km]", title="Radiative-convective profile")
right.set(xlabel="change [K]", title=f"Surface warming {warming[0]:.2f} K")
left.legend()
fig.tight_layout()

plt.show()
Total running time of the script: (0 minutes 0.175 seconds)
