Note
Go to the end to download the full example code or to run this example in your browser via JupyterLite.
Richter’s magnitude scale (1935)#
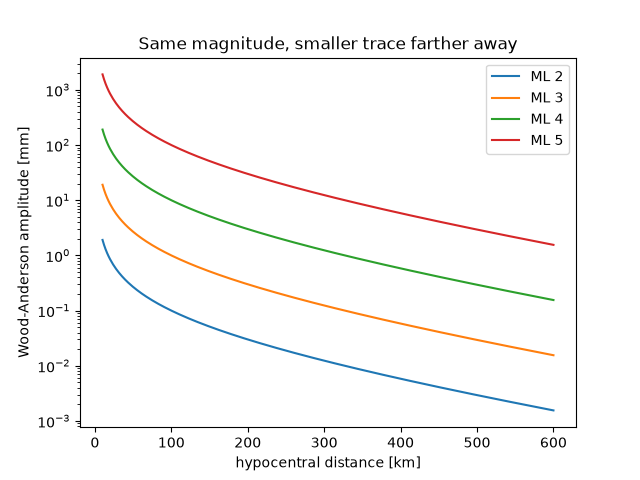
Charles Richter ranked southern California earthquakes by the logarithm of the peak amplitude on a Wood-Anderson seismometer, corrected for distance. Magnitude 3 is a 1 mm trace at 100 km, and each unit is a tenfold amplitude. The distance correction used here is Hutton and Boore’s 1987 calibration.
import matplotlib.pyplot as plt
import numpy as np

from earthsciencekit.seismology import local_magnitude

distance = np.linspace(10e3, 600e3, 300)
assert np.isclose(local_magnitude(1e-3, 100e3), 3)
fig, ax = plt.subplots()
for magnitude in [2, 3, 4, 5]:
    # Invert the scale for the amplitude that the same event produces at each distance.
    amplitude = 1e-3 * 10 ** (magnitude - local_magnitude(1e-3, distance))
    np.testing.assert_allclose(local_magnitude(amplitude, distance), magnitude)
    ax.semilogy(distance / 1e3, amplitude * 1e3, label=f"ML {magnitude}")
ax.set(xlabel="hypocentral distance [km]", ylabel="Wood-Anderson amplitude [mm]", title="Same magnitude, smaller trace farther away")
ax.legend()

plt.show()
Total running time of the script: (0 minutes 0.187 seconds)
