Note
Go to the end to download the full example code or to run this example in your browser via JupyterLite.
Wetherill’s concordia (1956)#
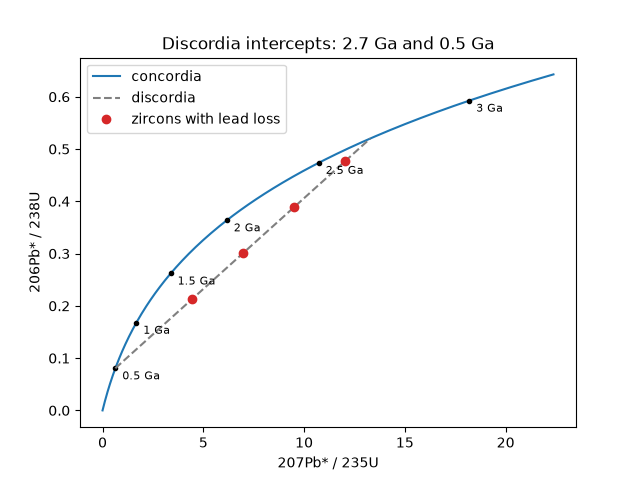
George Wetherill plotted the two uranium-lead clocks against each other. Minerals that stayed closed lie on a curve, the concordia, where both give the same age. Zircons that lost part of their lead in a later event fall on a straight chord, the discordia, whose two intersections with the concordia date the crystallization and the lead loss.
import matplotlib.pyplot as plt
import numpy as np
from scipy.optimize import brentq

from earthsciencekit.units import convert
from earthsciencekit.volcanology import concordia_ratios

formed, reset = convert(2.7, "Ga", "s"), convert(0.5, "Ga", "s")
upper, lower = concordia_ratios(formed), concordia_ratios(reset)
loss = np.array([0.1, 0.3, 0.5, 0.7])
zircons = (1 - loss)[:, None] * upper + loss[:, None] * lower
slope, intercept = np.polyfit(zircons[:, 0], zircons[:, 1], 1)


def gap(age):
    x, y = concordia_ratios(age)
    return y - (intercept + slope * x)


ages = [brentq(gap, convert(a, "Ga", "s"), convert(b, "Ga", "s")) for a, b in [(0.1, 1.5), (1.5, 4.0)]]
assert np.allclose(convert(np.array(ages), "s", "Ga"), [0.5, 2.7])

curve = concordia_ratios(convert(np.linspace(0, 3.2, 200), "Ga", "s"))
ticks = concordia_ratios(convert(np.arange(0.5, 3.5, 0.5), "Ga", "s"))
fig, ax = plt.subplots()
ax.plot(*curve.T, label="concordia")
ax.plot(*ticks.T, "k.")
for age, point in zip(np.arange(0.5, 3.5, 0.5), ticks):
    ax.annotate(f"{age:g} Ga", point, textcoords="offset points", xytext=(5, -8), fontsize=8)
ax.plot([lower[0], upper[0]], [lower[1], upper[1]], "--", color="0.5", label="discordia")
ax.plot(*zircons.T, "o", color="C3", label="zircons with lead loss")
ax.set(xlabel="207Pb* / 235U", ylabel="206Pb* / 238U", title="Discordia intercepts: 2.7 Ga and 0.5 Ga")
ax.legend()

plt.show()
Total running time of the script: (0 minutes 0.097 seconds)
