Note
Go to the end to download the full example code or to run this example in your browser via JupyterLite.
Gauss’s spherical-harmonic geomagnetic field (1839)#
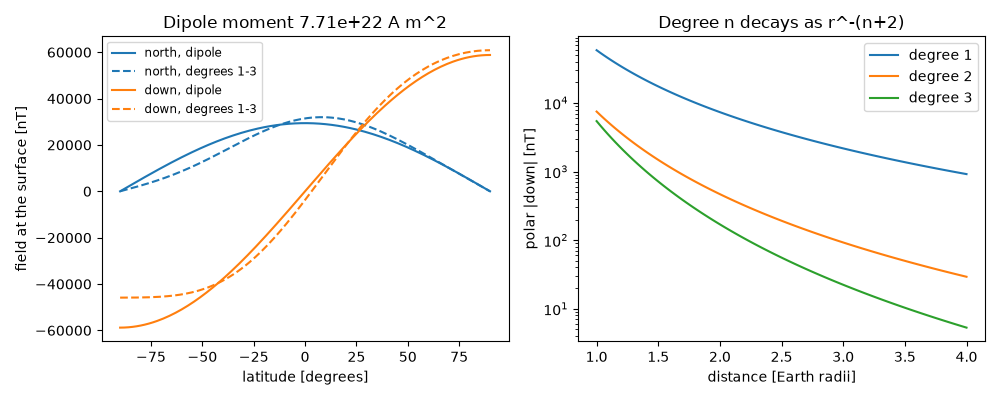
Carl Friedrich Gauss wrote the magnetic potential outside the Earth as a sum of spherical harmonics and fitted its coefficients to observatory data. The fit proved that the field comes from inside the Earth, and its degree-1 terms gave the strength and tilt of the best-fitting dipole. The same expansion, the International Geomagnetic Reference Field, is still used: its 2020 coefficients give a dipole moment of 7.7e22 A m^2 tilted about 9.4 degrees from the axis. The higher degrees fall off faster with distance, so the dipole dominates far from the core.
import matplotlib.pyplot as plt
import numpy as np

from earthsciencekit.constants import MU0
from earthsciencekit.geophysics import dipole_field, gauss_dipole_moment, zonal_field
from earthsciencekit.units import convert

a = 6371.2e3
g10, g11, h11 = convert(np.array([-29404.8, -1450.9, 4652.5]), "nT", "T")  # IGRF-13, epoch 2020
zonal = {1: g10, 2: convert(-2500.0, "nT", "T"), 3: convert(1360.0, "nT", "T")}  # g20 and g30 rounded
moment = gauss_dipole_moment(g10, g11, h11, a)
tilt = np.arccos(abs(g10) / np.sqrt(g10**2 + g11**2 + h11**2))
assert np.isclose(moment, 7.7e22, rtol=0.01) and 9 < convert(tilt, "rad", "degree") < 10

latitude = np.linspace(-np.pi / 2, np.pi / 2, 181)
dipole = zonal_field(latitude, a, 1, g10, a)
np.testing.assert_allclose(dipole, dipole_field(latitude, a, -4 * np.pi * a**3 * g10 / MU0), atol=1e-15)
total = sum(zonal_field(latitude, a, n, g, a) for n, g in zonal.items())

fig, (left, right) = plt.subplots(1, 2, figsize=(10, 4))
degrees = convert(latitude, "rad", "degree")
for index, name in enumerate(["north", "down"]):
    left.plot(degrees, convert(dipole[:, index], "T", "nT"), color=f"C{index}", label=f"{name}, dipole")
    left.plot(degrees, convert(total[:, index], "T", "nT"), "--", color=f"C{index}", label=f"{name}, degrees 1-3")
left.set(xlabel="latitude [degrees]", ylabel="field at the surface [nT]", title=f"Dipole moment {moment:.2e} A m^2")
left.legend(fontsize="small")
distance = np.linspace(a, 4 * a, 100)
for n, g in zonal.items():
    right.semilogy(distance / a, convert(np.abs(zonal_field(np.pi / 2, distance, n, g, a)[:, 1]), "T", "nT"), label=f"degree {n}")
right.set(xlabel="distance [Earth radii]", ylabel="polar |down| [nT]", title="Degree n decays as r^-(n+2)")
right.legend()
fig.tight_layout()

plt.show()
Total running time of the script: (0 minutes 0.323 seconds)
