Note
Go to the end to download the full example code or to run this example in your browser via JupyterLite.
Barnola’s Vostok CO2 record (1987)#
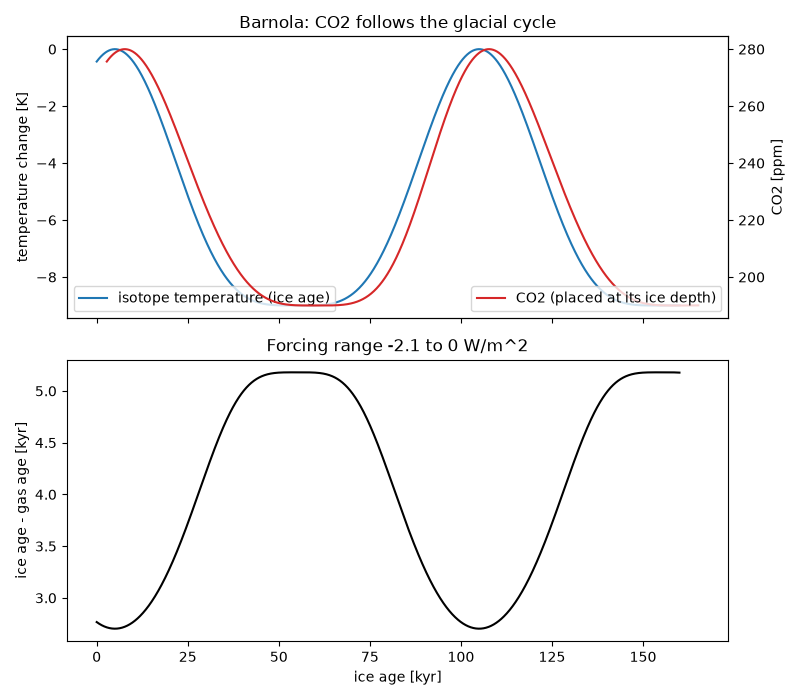
Jean-Marc Barnola and colleagues measured the carbon dioxide in air bubbles from the Vostok ice core through the last glacial cycle, 160,000 years. CO2 was about 190 ppm in the glacial periods and 280 ppm in the interglacials, and tracked the isotope temperature closely. The air is younger than the ice that holds it, because the firn stays open to the atmosphere until the bubbles close about 100 m down, and the gap is largest in the dry glacial climate. The example uses a synthetic record with Vostok-like amplitudes.
import matplotlib.pyplot as plt
import numpy as np

from earthsciencekit.climate import co2_forcing
from earthsciencekit.constants import ICE_DENSITY, SECONDS_PER_YEAR
from earthsciencekit.glaciology import gas_age_difference

age = np.linspace(0, 160e3, 1601)  # years, ice age
warmth = 0.5 * (1 + np.cos(2 * np.pi * (age - 5e3) / 100e3)) ** 2 / 2  # 0 glacial, 1 interglacial
warmth = warmth / warmth.max()
temperature_change = -9 + 9 * warmth  # K, relative to today
accumulation = (0.012 + 0.011 * warmth) / SECONDS_PER_YEAR  # m ice/s
offset = gas_age_difference(95.0, 600.0, ICE_DENSITY, accumulation) / SECONDS_PER_YEAR
co2 = 190 + 90 * warmth  # ppm at the gas age
assert 2e3 < offset.min() < offset.max() < 6e3
forcing = co2_forcing(co2, 280, 5.35)
assert np.isclose(forcing.min(), 5.35 * np.log(190 / 280)) and np.corrcoef(forcing, temperature_change)[0, 1] > 0.99

fig, (top, bottom) = plt.subplots(2, 1, figsize=(8, 7), sharex=True)
top.plot(age / 1e3, temperature_change, color="tab:blue", label="isotope temperature (ice age)")
twin = top.twinx()
twin.plot((age + offset) / 1e3, co2, color="tab:red", label="CO2 (placed at its ice depth)")
top.set(ylabel="temperature change [K]", title="Barnola: CO2 follows the glacial cycle")
twin.set_ylabel("CO2 [ppm]")
top.legend(loc="lower left")
twin.legend(loc="lower right")
bottom.plot(age / 1e3, offset / 1e3, color="k")
bottom.set(xlabel="ice age [kyr]", ylabel="ice age - gas age [kyr]", title=f"Forcing range {forcing.min():.1f} to 0 W/m^2")
fig.tight_layout()

plt.show()
Total running time of the script: (0 minutes 0.229 seconds)
