Note
Go to the end to download the full example code or to run this example in your browser via JupyterLite.
Nye’s crevasse depth (1955)#
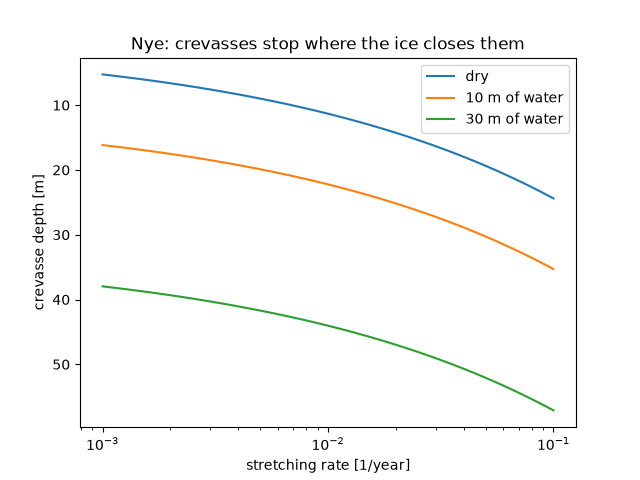
John Nye argued that a crevasse stays open only down to the depth where the pressure of the overlying ice equals the tensile stress from stretching, which Glen’s law gives from the strain rate. Dry crevasses therefore reach only a few tens of metres. Water in a crevasse adds its own pressure and drives it deeper, which is how meltwater can fracture an entire ice shelf.
import matplotlib.pyplot as plt
import numpy as np

from earthsciencekit.constants import GRAVITY, ICE_DENSITY, SECONDS_PER_YEAR
from earthsciencekit.glaciology import nye_crevasse_depth, water_filled_crevasse_depth

rate = np.logspace(-3, -1, 100) / SECONDS_PER_YEAR
dry = nye_crevasse_depth(rate, 2.4e-24, 3, ICE_DENSITY, GRAVITY)
assert np.all((dry > 5) & (dry < 60)) and np.isclose(dry[-1] / dry[0], 100 ** (1 / 3))
fig, ax = plt.subplots()
ax.semilogx(rate * SECONDS_PER_YEAR, dry, label="dry")
for water in (10, 30):
    wet = water_filled_crevasse_depth(rate, 2.4e-24, 3, water, ICE_DENSITY, 1000, GRAVITY)
    ax.semilogx(rate * SECONDS_PER_YEAR, wet, label=f"{water} m of water")
ax.invert_yaxis()
ax.set(xlabel="stretching rate [1/year]", ylabel="crevasse depth [m]", title="Nye: crevasses stop where the ice closes them")
ax.legend()

plt.show()
Total running time of the script: (0 minutes 0.115 seconds)
