Note
Go to the end to download the full example code or to run this example in your browser via JupyterLite.
Bouguer’s mountain attraction (1749)#
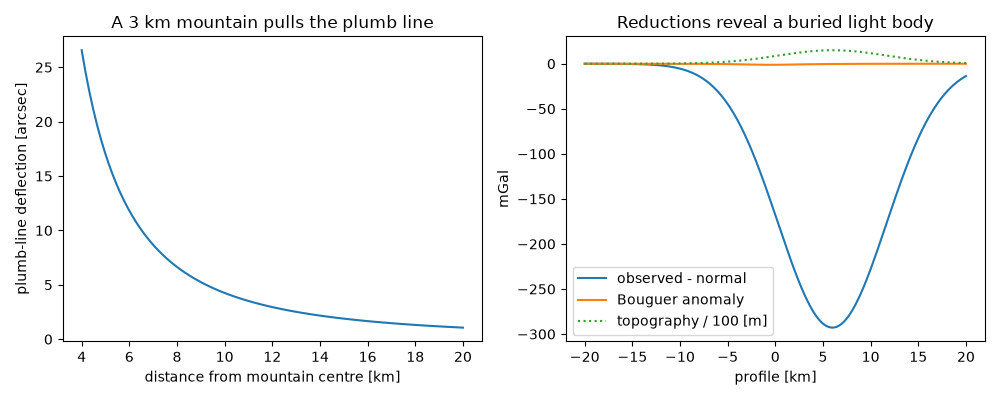
On the French expedition to Peru, Pierre Bouguer measured how far the volcano Chimborazo pulled a plumb line aside, the first attempt to see a mountain’s gravity. He also measured gravity on the high plateau at Quito and found it larger than the height alone predicted: the rock under the station pulls too. Removing that slab of rock (the Bouguer correction) together with the effect of height (the free-air correction) leaves the attraction of buried masses, the Bouguer anomaly that gravity surveys still map.
import matplotlib.pyplot as plt
import numpy as np

from earthsciencekit.constants import EARTH_RADIUS
from earthsciencekit.geophysics import bouguer_anomaly, bouguer_correction, free_air_correction, normal_gravity, sphere_gravity
from earthsciencekit.units import convert

distance = np.linspace(4e3, 2e4, 100)
pull = sphere_gravity(distance, 0, 3e3, 2670)[..., 0]
deflection = convert(np.arctan(np.abs(pull) / 9.78), "rad", "degree") * 3600
assert np.isclose(sphere_gravity(2 * distance[0], 0, 3e3, 2670)[0], pull[0] / 4)
assert 1 < deflection[0] < 100

x = np.linspace(-2e4, 2e4, 201)
height = 1500 * np.exp(-(((x - 6e3) / 8e3) ** 2))
normal = normal_gravity(np.radians(-1.5))
buried = sphere_gravity(x, 4e3 + height, 1.5e3, -300)[..., 1]
observed = normal - free_air_correction(height, normal, EARTH_RADIUS) + bouguer_correction(2670, height) + buried
anomaly = bouguer_anomaly(observed, normal, height, 2670, EARTH_RADIUS)
np.testing.assert_allclose(anomaly, buried, atol=1e-12)

fig, (left, right) = plt.subplots(1, 2, figsize=(10, 4))
left.plot(distance / 1e3, deflection)
left.set(xlabel="distance from mountain centre [km]", ylabel="plumb-line deflection [arcsec]", title="A 3 km mountain pulls the plumb line")
right.plot(x / 1e3, convert(observed - normal, "m/s^2", "mGal"), label="observed - normal")
right.plot(x / 1e3, convert(anomaly, "m/s^2", "mGal"), label="Bouguer anomaly")
right.plot(x / 1e3, height / 100, ":", label="topography / 100 [m]")
right.set(xlabel="profile [km]", ylabel="mGal", title="Reductions reveal a buried light body")
right.legend()
fig.tight_layout()

plt.show()
Total running time of the script: (0 minutes 0.220 seconds)
