Note
Go to the end to download the full example code or to run this example in your browser via JupyterLite.
Holmes’s age of the Earth (1913)#
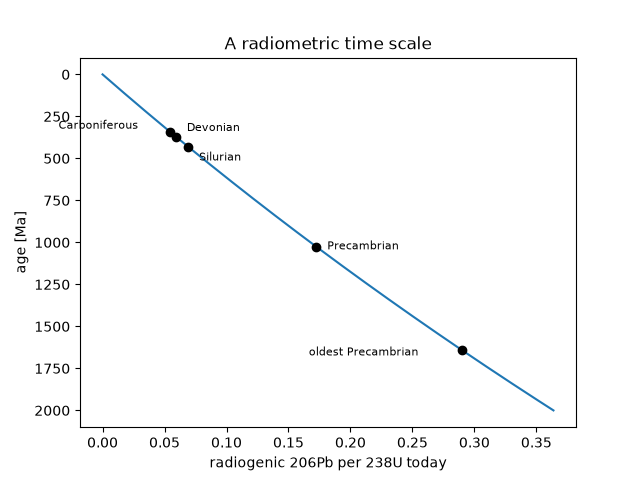
Arthur Holmes, in The Age of the Earth, combined lead-uranium ages with the order of the strata to build the first radiometric time scale. His ages placed the Devonian near 370 million years and the oldest Precambrian rocks near 1600 million years, far beyond Kelvin’s cooling estimate. Forward accumulation shows the lead-to-uranium ratio each period would carry today.
import matplotlib.pyplot as plt
import numpy as np

from earthsciencekit.constants import LAMBDA_U238
from earthsciencekit.units import convert
from earthsciencekit.volcanology import radiogenic_daughter, radiometric_age

# Ages in Ma from Holmes (1911, 1913)
periods = {"Carboniferous": 340, "Devonian": 370, "Silurian": 430, "Precambrian": 1025, "oldest Precambrian": 1640}
age = convert(np.array(list(periods.values()), float), "Ma", "s")
lead = radiogenic_daughter(1.0, LAMBDA_U238, age)
assert np.allclose(radiometric_age(lead, LAMBDA_U238), age)
assert np.all(np.diff(lead) > 0)

grid = convert(np.linspace(0, 2000, 201), "Ma", "s")
fig, ax = plt.subplots()
ax.plot(radiogenic_daughter(1.0, LAMBDA_U238, grid), convert(grid, "s", "Ma"))
for (name, value), ratio, offset in zip(periods.items(), lead, [(-80, 2), (8, 4), (8, -10), (8, -2), (-110, -4)]):
    ax.plot(ratio, value, "ko")
    ax.annotate(name, (ratio, value), textcoords="offset points", xytext=offset, fontsize=8)
ax.invert_yaxis()
ax.set(xlabel="radiogenic 206Pb per 238U today", ylabel="age [Ma]", title="A radiometric time scale")

plt.show()
Total running time of the script: (0 minutes 0.094 seconds)
