Note
Go to the end to download the full example code or to run this example in your browser via JupyterLite.
Darcy’s law (1856)#
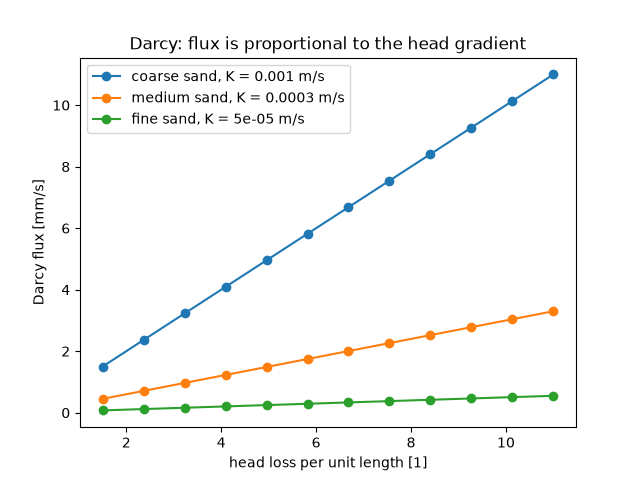
Henry Darcy built sand filters for the fountains of Dijon and measured the flow through a vertical column of sand under different heads. The discharge was proportional to the head lost across the column divided by its length, with a constant that depends on the sand, now the hydraulic conductivity. The example repeats the experiment: heads read on the manometers combine elevation and pressure, every sand gives a straight line through the origin, and water in the pores moves faster than the flux by the inverse porosity.
import matplotlib.pyplot as plt
import numpy as np

from earthsciencekit.constants import GRAVITY
from earthsciencekit.hydrology import darcy_flux, hydraulic_head, seepage_velocity

length = 1.0  # m of sand
pressure_top = 1000 * GRAVITY * np.linspace(0.5, 10, 12)  # Pa above the sand
head_top = hydraulic_head(length, pressure_top, 1000, GRAVITY)
head_bottom = hydraulic_head(0.0, 0.0, 1000, GRAVITY)  # free outflow at the base
gradient = (head_bottom - head_top) / length
fig, ax = plt.subplots()
for conductivity, sand in [(1e-3, "coarse sand"), (3e-4, "medium sand"), (5e-5, "fine sand")]:
    flux = darcy_flux(conductivity, gradient)
    assert np.allclose(np.polyfit(-gradient, flux, 1), [conductivity, 0], atol=1e-12)
    ax.plot(-gradient, flux * 1e3, "o-", label=f"{sand}, K = {conductivity:g} m/s")
assert np.isclose(seepage_velocity(darcy_flux(1e-3, -1), 0.35), 1e-3 / 0.35)
ax.set(xlabel="head loss per unit length [1]", ylabel="Darcy flux [mm/s]", title="Darcy: flux is proportional to the head gradient")
ax.legend()

plt.show()
Total running time of the script: (0 minutes 0.085 seconds)
