Note
Go to the end to download the full example code or to run this example in your browser via JupyterLite.
Perrault’s catchment water balance (1674)#
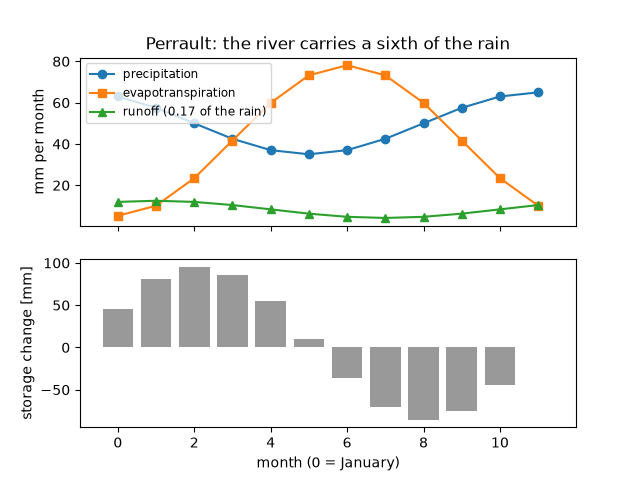
Pierre Perrault measured the rain at Paris for three years and estimated the flow of the Seine above Aignay-le-Duc. The river carried only about a sixth of the rain that fell on its basin, so rainfall was more than enough to feed it, against the old view that rivers rise from the sea through the ground. The water balance makes the same bookkeeping explicit for a year of synthetic monthly rain, evaporation and runoff: the storage it implies rises in winter, falls in summer and returns to its starting value.
import matplotlib.pyplot as plt
import numpy as np

from earthsciencekit.hydrology import runoff_coefficient, water_balance

month = np.arange(12)
rain = 50 + 15 * np.cos(2 * np.pi * (month - 11) / 12)  # mm per month
evaporation = 32 + 28 * np.cos(2 * np.pi * (month - 6) / 12)
runoff = rain.sum() / 6 * (1 + 0.5 * np.cos(2 * np.pi * (month - 1) / 12)) / 12
evaporation *= (rain.sum() - runoff.sum()) / evaporation.sum()  # close the annual balance
storage = np.cumsum(water_balance(rain, evaporation, runoff))
ratio = runoff_coefficient(runoff.sum(), rain.sum())
assert np.isclose(ratio, 1 / 6) and np.isclose(storage[-1], 0)

fig, (top, bottom) = plt.subplots(2, 1, sharex=True)
top.plot(month, rain, "o-", label="precipitation")
top.plot(month, evaporation, "s-", label="evapotranspiration")
top.plot(month, runoff, "^-", label=f"runoff ({ratio:.2f} of the rain)")
top.set(ylabel="mm per month", title="Perrault: the river carries a sixth of the rain")
top.legend(fontsize="small")
bottom.bar(month, storage, color="0.6")
bottom.set(xlabel="month (0 = January)", ylabel="storage change [mm]")

plt.show()
Total running time of the script: (0 minutes 0.116 seconds)
