Note
Go to the end to download the full example code or to run this example in your browser via JupyterLite.
Ekman’s dead water (1904)#
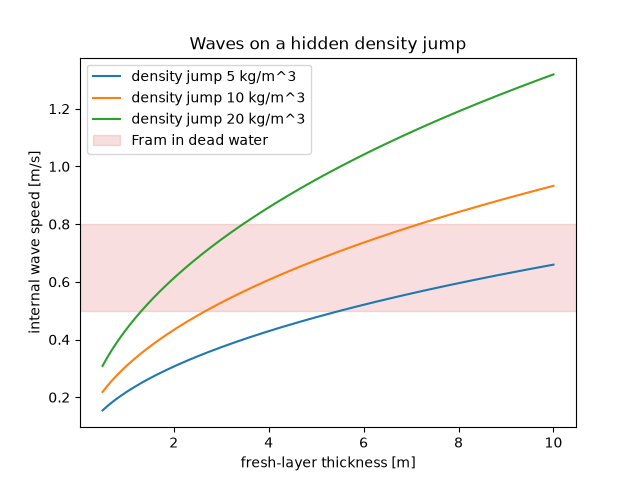
On Nansen’s Fram expedition the ship slowed to a crawl in fjords where a thin
layer of meltwater lay over salty sea water. Vagn Walfrid Ekman showed that
the ship was making waves on the hidden density jump. Those internal waves
travel at about sqrt(g' h) with the reduced gravity g' = g d_rho / rho,
a few tens of centimetres per second, so a slow ship pours its energy into
them.
import matplotlib.pyplot as plt
import numpy as np

from earthsciencekit.constants import GRAVITY
from earthsciencekit.oceanography import internal_wave_speed, reduced_gravity, shallow_wave_speed

upper = np.linspace(0.5, 10, 200)
fig, ax = plt.subplots()
for contrast in [5, 10, 20]:
    gprime = reduced_gravity(contrast, 1025, GRAVITY)
    deep_limit = internal_wave_speed(gprime, upper, 1e6)
    np.testing.assert_allclose(deep_limit / shallow_wave_speed(upper, GRAVITY), np.sqrt(contrast / 1025), rtol=1e-5)
    ax.plot(upper, internal_wave_speed(gprime, upper, 100), label=f"density jump {contrast} kg/m^3")
ax.axhspan(0.5, 0.8, color="tab:red", alpha=0.15, label="Fram in dead water")
ax.set(xlabel="fresh-layer thickness [m]", ylabel="internal wave speed [m/s]", title="Waves on a hidden density jump")
ax.legend()

plt.show()
Total running time of the script: (0 minutes 0.091 seconds)
