Note
Go to the end to download the full example code or to run this example in your browser via JupyterLite.
Gilbert’s magnetic Earth (1600)#
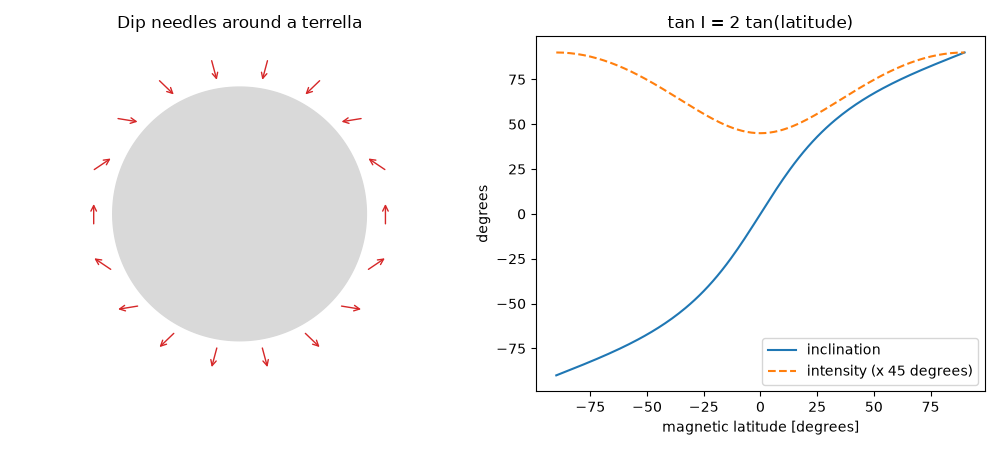
William Gilbert carved a sphere of lodestone, his terrella, and carried a
small dip needle over it. The needle lay flat at the terrella’s equator, stood
vertical at its poles and dipped steadily in between, just as compass needles
did at sea. He concluded that the Earth itself is a great magnet. For an axial
dipole the dip obeys tan(I) = 2 tan(latitude) and the field at the poles is
twice that at the equator.
import matplotlib.pyplot as plt
import numpy as np

from earthsciencekit.geophysics import dipole_field, dipole_inclination, field_elements
from earthsciencekit.units import convert

latitude = np.linspace(-np.pi / 2, np.pi / 2, 181)
inclination = dipole_inclination(latitude)
field = dipole_field(latitude, 1.0, 1.0)
intensity = field_elements(field[..., 0], 0, field[..., 1])[..., 2]
assert np.isclose(intensity[-1] / intensity[90], 2)
np.testing.assert_allclose(np.tan(inclination[1:-1]), 2 * np.tan(latitude[1:-1]))

fig, (left, right) = plt.subplots(1, 2, figsize=(10, 4.5))
circle = np.linspace(0, 2 * np.pi, 361)
left.fill(np.cos(circle), np.sin(circle), color="0.85")
for lat in np.radians(np.arange(-80, 81, 20)):
    north, down = dipole_field(lat, 1.0, 1.0)
    direction = north * np.array([-np.sin(lat), np.cos(lat)]) + down * np.array([-np.cos(lat), -np.sin(lat)])
    direction /= np.hypot(*direction)
    for side in (1, -1):
        centre = 1.15 * np.array([side * np.cos(lat), np.sin(lat)])
        needle = 0.1 * direction * np.array([side, 1])
        left.annotate("", centre + needle, centre - needle, arrowprops={"arrowstyle": "->", "color": "C3"})
left.set(xlim=(-1.4, 1.4), ylim=(-1.4, 1.4), aspect="equal", title="Dip needles around a terrella")
left.axis("off")
right.plot(convert(latitude, "rad", "degree"), convert(inclination, "rad", "degree"), label="inclination")
right.plot(convert(latitude, "rad", "degree"), 45 * intensity / intensity[90], "--", label="intensity (x 45 degrees)")
right.set(xlabel="magnetic latitude [degrees]", ylabel="degrees", title="tan I = 2 tan(latitude)")
right.legend()
fig.tight_layout()

plt.show()
Total running time of the script: (0 minutes 0.196 seconds)
