Note
Go to the end to download the full example code or to run this example in your browser via JupyterLite.
Magnus’s vapour-pressure formula (1844)#
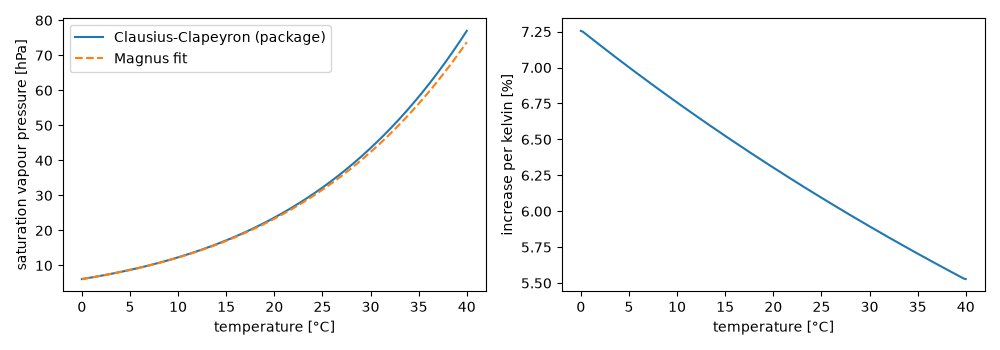
Gustav Magnus measured the pressure of water vapour in equilibrium with liquid water and fitted it with an exponential in temperature. Clausius later derived the same shape from thermodynamics. The package uses the Clausius-Clapeyron form with a constant latent heat. Over 0-40 °C it agrees with a modern Magnus fit (Alduchov and Eskridge, 1996) to within 5%, and both give the 6-7% increase per kelvin that makes warm air hold so much more water.
relative humidity of 15 hPa vapour at 25 °C: 0.47
import matplotlib.pyplot as plt
import numpy as np

from earthsciencekit.atmosphere import relative_humidity, saturation_vapor_pressure

celsius = np.linspace(0, 40, 201)
clausius = saturation_vapor_pressure(celsius + 273.15)
magnus = 610.94 * np.exp(17.625 * celsius / (celsius + 243.04))
assert np.all(np.abs(clausius / magnus - 1) < 0.05)
growth = np.gradient(np.log(clausius), celsius)
assert np.all((growth > 0.055) & (growth < 0.075))
print(f"relative humidity of 15 hPa vapour at 25 °C: {relative_humidity(1500, saturation_vapor_pressure(298.15)):.2f}")

fig, axes = plt.subplots(1, 2, figsize=(10, 3.5))
axes[0].plot(celsius, clausius / 100, label="Clausius-Clapeyron (package)")
axes[0].plot(celsius, magnus / 100, ls="--", label="Magnus fit")
axes[0].set(xlabel="temperature [°C]", ylabel="saturation vapour pressure [hPa]")
axes[0].legend()
axes[1].plot(celsius, growth * 100)
axes[1].set(xlabel="temperature [°C]", ylabel="increase per kelvin [%]")
fig.tight_layout()

plt.show()
Total running time of the script: (0 minutes 0.181 seconds)
