Note
Go to the end to download the full example code or to run this example in your browser via JupyterLite.
Rossby’s planetary waves (1939)#
Carl-Gustaf Rossby explained the slow eastward drift of the large troughs and
ridges in the westerlies. Because the Coriolis parameter grows northward at
the rate beta, a vorticity wave propagates westward relative to the wind
at beta / k^2. Long waves therefore stand still or retrogress, and the
stationary wavelength is 2 pi sqrt(U / beta). These waves are large
scale, with Rossby numbers well below one.
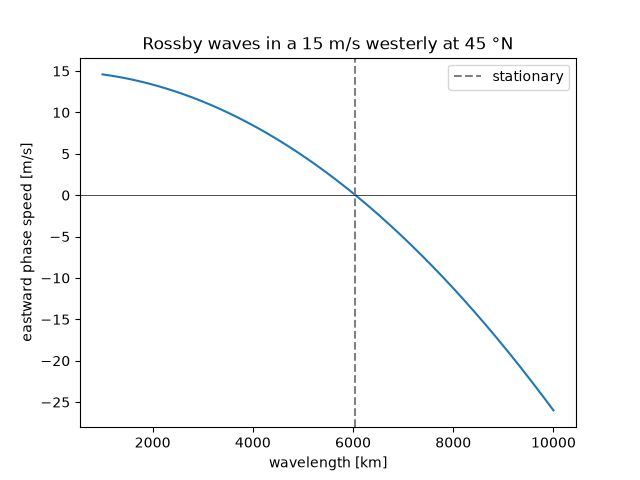
stationary wavelength at 45 °N for 15 m/s: 6048 km
import matplotlib.pyplot as plt
import numpy as np

from earthsciencekit.atmosphere import coriolis_parameter, rossby_number, rossby_wave_speed
from earthsciencekit.constants import EARTH_RADIUS, OMEGA_EARTH

latitude = np.deg2rad(45)
beta = 2 * OMEGA_EARTH * np.cos(latitude) / EARTH_RADIUS
wind = 15.0
wavelength = np.linspace(1000e3, 10000e3, 300)
speed = rossby_wave_speed(wind, beta, 2 * np.pi / wavelength)
stationary = 2 * np.pi * np.sqrt(wind / beta)
assert abs(float(rossby_wave_speed(wind, beta, 2 * np.pi / stationary))) < 1e-12
assert rossby_number(wind, 1e6, coriolis_parameter(latitude)) < 0.2
print(f"stationary wavelength at 45 °N for 15 m/s: {stationary / 1e3:.0f} km")

fig, ax = plt.subplots()
ax.plot(wavelength / 1e3, speed)
ax.axhline(0, color="k", lw=0.5)
ax.axvline(stationary / 1e3, color="0.5", ls="--", label="stationary")
ax.set(xlabel="wavelength [km]", ylabel="eastward phase speed [m/s]", title="Rossby waves in a 15 m/s westerly at 45 °N")
ax.legend()

plt.show()
Total running time of the script: (0 minutes 0.081 seconds)
