Note
Go to the end to download the full example code or to run this example in your browser via JupyterLite.
Wilson and Head’s magma ascent in dikes (1981)#
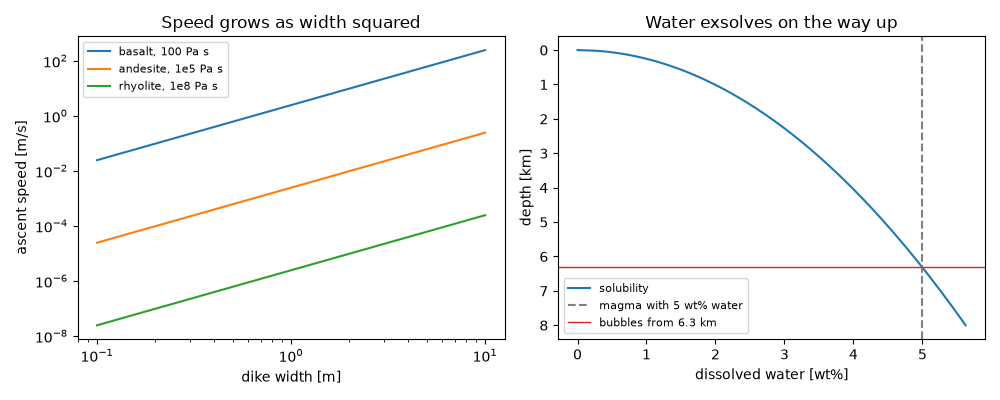
Lionel Wilson and James Head followed magma up dikes from its source to the surface on the Earth and the Moon. Buoyancy drives laminar flow between the walls at a speed that grows as the square of the width, and the magma’s dissolved water comes out of solution as the pressure falls. Basalt in a dike a metre wide rises at metres per second; a viscous rhyolite barely moves.
import matplotlib.pyplot as plt
import numpy as np

from earthsciencekit.constants import GRAVITY
from earthsciencekit.volcanology import dike_ascent_velocity, water_solubility

width = np.logspace(-1, 1, 100)
magmas = {"basalt, 100 Pa s": 100.0, "andesite, 1e5 Pa s": 1e5, "rhyolite, 1e8 Pa s": 1e8}
fig, (left, right) = plt.subplots(1, 2, figsize=(10, 4))
for name, viscosity in magmas.items():
    left.loglog(width, dike_ascent_velocity(width, 300, viscosity, GRAVITY), label=name)
speed = dike_ascent_velocity(1.0, 300, 100, GRAVITY)
assert 2700 * speed * 1.0 / 100 < 2000  # laminar
left.set(xlabel="dike width [m]", ylabel="ascent speed [m/s]", title="Speed grows as width squared")
left.legend(fontsize=8)

depth = np.linspace(0, 8000, 400)
pressure = 2400 * GRAVITY * depth
dissolved = water_solubility(pressure, 4.1e-6)
saturation = (0.05 / 4.1e-6) ** 2 / (2400 * GRAVITY)
assert np.isclose(water_solubility(2400 * GRAVITY * saturation, 4.1e-6), 0.05)
right.plot(100 * dissolved, depth / 1e3, label="solubility")
right.axvline(5, color="0.5", ls="--", label="magma with 5 wt% water")
right.axhline(saturation / 1e3, color="C3", lw=1, label=f"bubbles from {saturation / 1e3:.1f} km")
right.invert_yaxis()
right.set(xlabel="dissolved water [wt%]", ylabel="depth [km]", title="Water exsolves on the way up")
right.legend(fontsize=8)
fig.tight_layout()

plt.show()
Total running time of the script: (0 minutes 0.299 seconds)
