Note
Go to the end to download the full example code or to run this example in your browser via JupyterLite.
Richards’s equation (1931)#
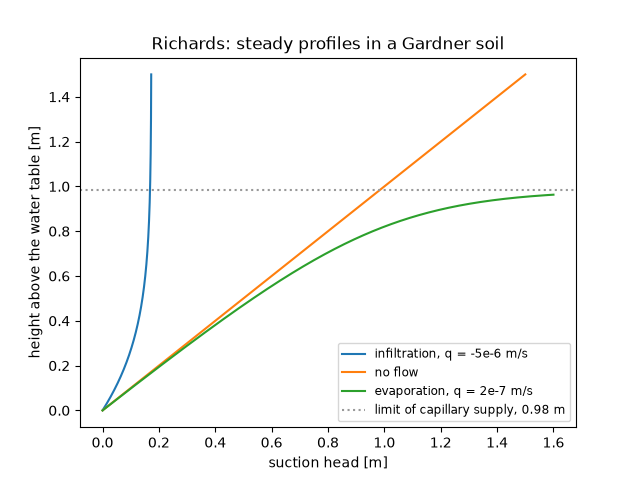
Lorenzo Richards extended Darcy’s law to unsaturated soil, where the conductivity depends on the capillary suction, and combined it with conservation of water into the equation that bears his name. In steady flow the flux is the same at every height, and for Gardner’s exponential conductivity the suction profile above a water table has a closed form: hydrostatic without flow, a unit-gradient tail under infiltration, and a limit height above which evaporation cannot be supplied from below.
import matplotlib.pyplot as plt
import numpy as np

from earthsciencekit.hydrology import gardner_conductivity, richards_steady_head, unsaturated_darcy_flux

conductivity, alpha = 1e-5, 4.0  # m/s and 1/m
height = np.linspace(0, 1.5, 3001)
fig, ax = plt.subplots()
for flux, label in [(-5e-6, "infiltration, q = -5e-6 m/s"), (0.0, "no flow"), (2e-7, "evaporation, q = 2e-7 m/s")]:
    top = height if flux <= 0 else height[height < np.log(1 + conductivity / flux) / alpha * 0.98]
    head = richards_steady_head(top, flux, conductivity, alpha)
    result = unsaturated_darcy_flux(gardner_conductivity(head, conductivity, alpha), np.gradient(head, top))
    assert np.allclose(result[1:-1], flux, atol=1e-3 * conductivity)
    ax.plot(-head, top, label=label)
limit = np.log(1 + conductivity / 2e-7) / alpha
ax.axhline(limit, color="0.6", ls=":", label=f"limit of capillary supply, {limit:.2f} m")
ax.set(xlabel="suction head [m]", ylabel="height above the water table [m]", title="Richards: steady profiles in a Gardner soil")
ax.legend(fontsize="small")

plt.show()
Total running time of the script: (0 minutes 0.109 seconds)
