Note
Go to the end to download the full example code or to run this example in your browser via JupyterLite.
Newhall and Self’s Volcanic Explosivity Index (1982)#
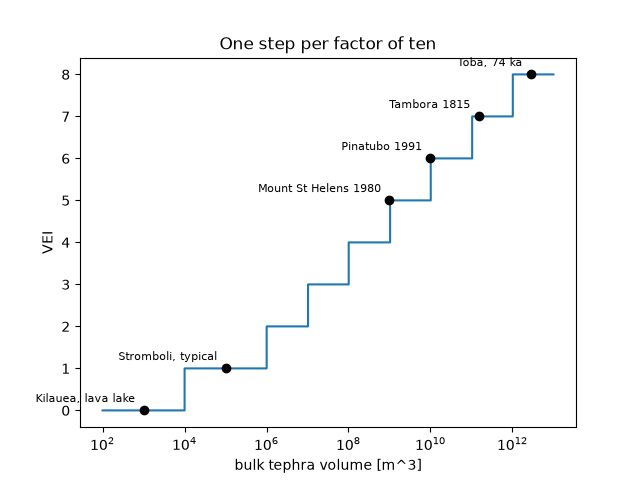
Chris Newhall and Stephen Self combined erupted volume, column height and eyewitness descriptions into one index from 0 to 8, so that eruptions in the historical record could be compared. Above VEI 2 each step is a factor of ten in tephra volume. Approximate volumes of a few well-known eruptions place them on the scale.
import matplotlib.pyplot as plt
import numpy as np

from earthsciencekit.volcanology import volcanic_explosivity_index

eruptions = {
    "Kilauea, lava lake": 1e3,
    "Stromboli, typical": 1e5,
    "Mount St Helens 1980": 1.0e9,
    "Pinatubo 1991": 1.0e10,
    "Tambora 1815": 1.5e11,
    "Toba, 74 ka": 2.8e12,
}
volume = np.array(list(eruptions.values()))
index = volcanic_explosivity_index(volume)
np.testing.assert_array_equal(index, [0, 1, 5, 6, 7, 8])

grid = np.logspace(2, 13, 600)
fig, ax = plt.subplots()
ax.semilogx(grid, volcanic_explosivity_index(grid), drawstyle="steps-post")
for (name, v), i in zip(eruptions.items(), index):
    ax.plot(v, i, "ko")
    ax.annotate(name, (v, i), textcoords="offset points", xytext=(-6, 6), ha="right", fontsize=8)
ax.set(xlabel="bulk tephra volume [m^3]", ylabel="VEI", title="One step per factor of ten", yticks=range(9))

plt.show()
Total running time of the script: (0 minutes 0.112 seconds)
