Note
Go to the end to download the full example code or to run this example in your browser via JupyterLite.
Rayleigh’s surface waves (1885)#
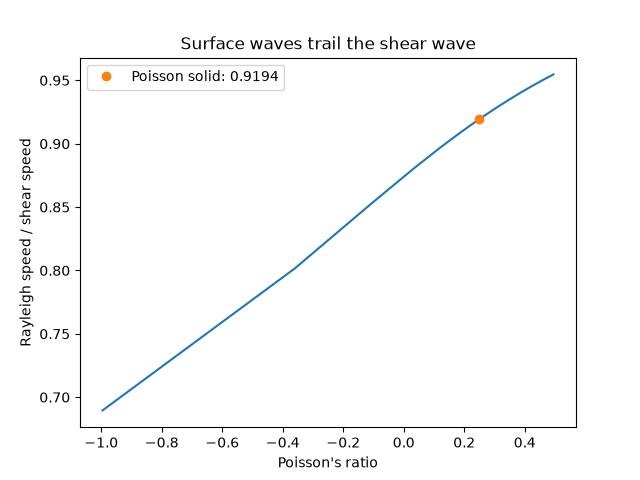
Lord Rayleigh found a wave bound to the free surface of an elastic solid, slower than the shear wave and decaying with depth. Its speed solves a cubic that depends only on Poisson’s ratio: about 0.92 of the shear speed in a Poisson solid. Because it spreads in two dimensions rather than three, it carries the largest motions on distant seismograms.
import matplotlib.pyplot as plt
import numpy as np

from earthsciencekit.seismology import poisson_ratio, rayleigh_wave_speed

vs = 1.0
vp = np.sqrt(np.linspace(4 / 3 + 1e-3, 100, 400)) * vs
ratio = rayleigh_wave_speed(vp, vs) / vs
nu = poisson_ratio(vp, vs)
assert np.isclose(rayleigh_wave_speed(np.sqrt(3), 1), np.sqrt(2 - 2 / np.sqrt(3)))
assert np.all(ratio < 1) and np.all(np.diff(ratio[np.argsort(nu)]) > 0)

fig, ax = plt.subplots()
ax.plot(nu, ratio)
ax.plot(0.25, np.sqrt(2 - 2 / np.sqrt(3)), "o", label="Poisson solid: 0.9194")
ax.set(xlabel="Poisson's ratio", ylabel="Rayleigh speed / shear speed", title="Surface waves trail the shear wave")
ax.legend()

plt.show()
Total running time of the script: (0 minutes 0.083 seconds)
