Note
Go to the end to download the full example code or to run this example in your browser via JupyterLite.
Nye’s perfectly plastic ice sheet (1951)#
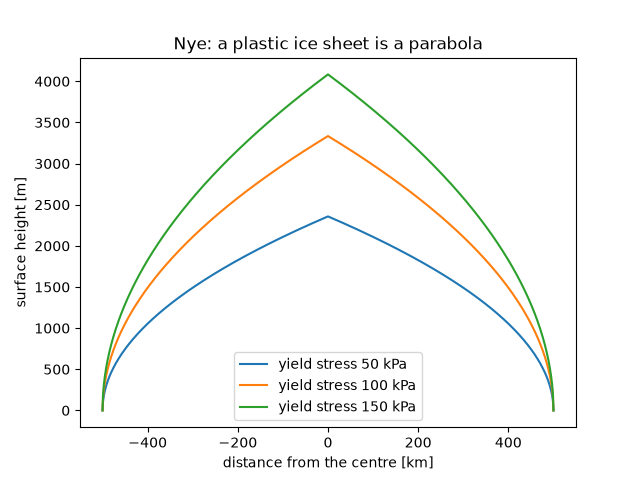
John Nye noticed that the basal shear stress under glaciers varies little, between about 50 and 150 kPa, and treated ice as a perfectly plastic solid that yields at a fixed stress. On a flat bed the ice sheet is then a parabola whose height depends only on the distance from its margin: an ice sheet 1000 km wide stands about 3.3 km high at its centre, as Greenland and Antarctica do.
import matplotlib.pyplot as plt
import numpy as np

from earthsciencekit.constants import GRAVITY, ICE_DENSITY
from earthsciencekit.glaciology import nye_plastic_profile

half_width = 500e3
x = np.linspace(-half_width, half_width, 1001)
fig, ax = plt.subplots()
for stress in (50e3, 100e3, 150e3):
    height = nye_plastic_profile(half_width - np.abs(x), stress, ICE_DENSITY, GRAVITY)
    ax.plot(x / 1e3, height, label=f"yield stress {stress / 1e3:.0f} kPa")
centre = nye_plastic_profile(half_width, 100e3, ICE_DENSITY, GRAVITY)
assert 3200 < centre < 3400 and np.isclose(nye_plastic_profile(4 * half_width, 100e3, ICE_DENSITY, GRAVITY), 2 * centre)
ax.set(xlabel="distance from the centre [km]", ylabel="surface height [m]", title="Nye: a plastic ice sheet is a parabola")
ax.legend()

plt.show()
Total running time of the script: (0 minutes 0.096 seconds)
