Note
Go to the end to download the full example code or to run this example in your browser via JupyterLite.
Stokes’s geoid formula (1849)#
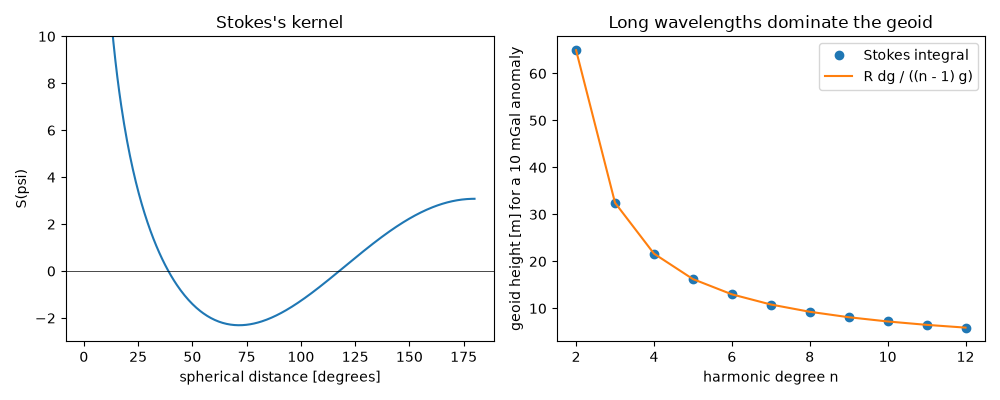
George Gabriel Stokes showed that gravity measured over the whole surface
fixes the shape of the level surface, the geoid, without any assumption about
the interior. The geoid height at a point is a weighted integral of the gravity
anomaly over the globe, with a kernel that depends only on spherical distance.
A gravity anomaly of spherical-harmonic degree n produces a geoid of the
same shape, scaled by R / ((n - 1) g): the geoid sees mostly the longest
wavelengths.
import matplotlib.pyplot as plt
import numpy as np
from scipy.integrate import quad
from scipy.special import eval_legendre

from earthsciencekit.constants import EARTH_RADIUS
from earthsciencekit.geophysics import degree_geoid_height, stokes_function
from earthsciencekit.units import convert

gravity, anomaly = 9.81, convert(10.0, "mGal", "m/s^2")
degrees = np.arange(2, 13)
integrated = []
for n in degrees:
    kernel_integral = quad(lambda psi: eval_legendre(n, np.cos(psi)) * stokes_function(psi) * np.sin(psi), 0, np.pi, limit=200)[0]
    integrated.append(EARTH_RADIUS / (4 * np.pi * gravity) * 2 * np.pi * anomaly * kernel_integral)
closed_form = degree_geoid_height(anomaly, degrees, EARTH_RADIUS, gravity)
np.testing.assert_allclose(integrated, closed_form, rtol=1e-6)

psi = np.linspace(0.01, np.pi, 400)
fig, (left, right) = plt.subplots(1, 2, figsize=(10, 4))
left.plot(convert(psi, "rad", "degree"), stokes_function(psi))
left.axhline(0, color="k", lw=0.5)
left.set(xlabel="spherical distance [degrees]", ylabel="S(psi)", ylim=(-3, 10), title="Stokes's kernel")
right.plot(degrees, integrated, "o", label="Stokes integral")
right.plot(degrees, closed_form, "-", label="R dg / ((n - 1) g)")
right.set(xlabel="harmonic degree n", ylabel="geoid height [m] for a 10 mGal anomaly", title="Long wavelengths dominate the geoid")
right.legend()
fig.tight_layout()

plt.show()
Total running time of the script: (0 minutes 0.276 seconds)
