Note
Go to the end to download the full example code or to run this example in your browser via JupyterLite.
von Bezold’s potential temperature (1888)#
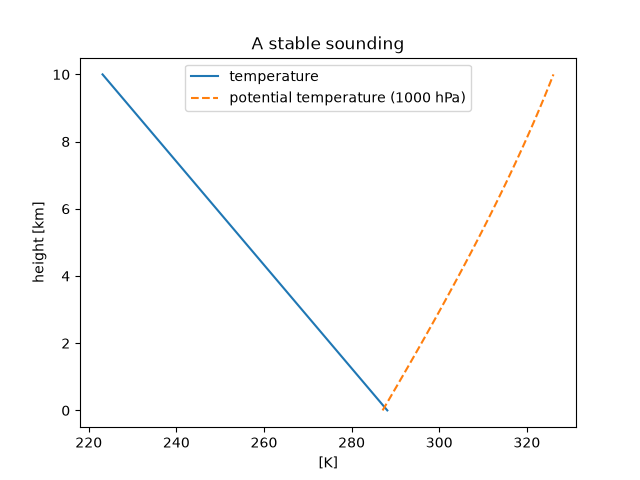
Wilhelm von Bezold named the temperature a sample of air would have if brought adiabatically to a standard pressure. Unlike temperature it does not change when dry air rises or sinks, so it labels air masses. In a sounding whose temperature falls more slowly than 9.8 K/km, potential temperature increases with height and the column is stable. The conversion back to temperature recovers the sounding exactly.
import matplotlib.pyplot as plt
import numpy as np

from earthsciencekit.atmosphere import barometric_pressure, potential_temperature, temperature_from_potential
from earthsciencekit.constants import GRAVITY

height = np.linspace(0, 10e3, 101)
temperature = 288.15 - 0.0065 * height
pressure = barometric_pressure(101325, height, 255, GRAVITY)
theta = potential_temperature(temperature, pressure, 1e5)
np.testing.assert_allclose(temperature_from_potential(theta, pressure, 1e5), temperature)
assert np.all(np.diff(theta) > 0)

fig, ax = plt.subplots()
ax.plot(temperature, height / 1000, label="temperature")
ax.plot(theta, height / 1000, ls="--", label="potential temperature (1000 hPa)")
ax.set(xlabel="[K]", ylabel="height [km]", title="A stable sounding")
ax.legend()

plt.show()
Total running time of the script: (0 minutes 0.074 seconds)
