Note
Go to the end to download the full example code or to run this example in your browser via JupyterLite.
Stefan’s fourth-power law (1879)#
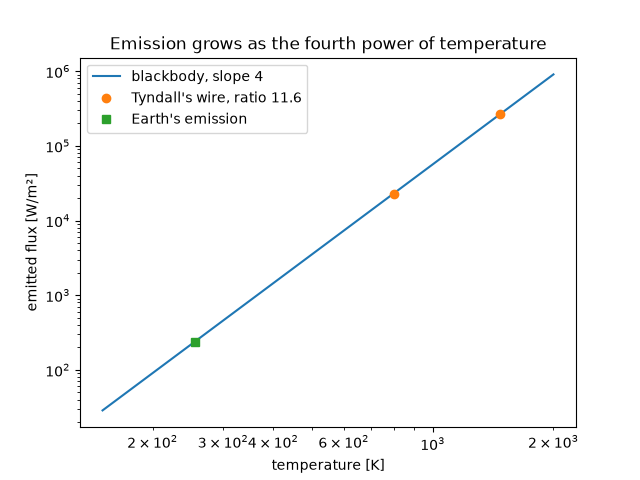
Josef Stefan noticed that John Tyndall’s measurements of a glowing platinum wire fit a simple law. The wire radiated 11.7 times more at 1200 °C than at 525 °C, and the ratio of the absolute temperatures to the fourth power is 11.6. Boltzmann derived the law from thermodynamics in 1884. It gives the outgoing longwave radiation of every planet.
import matplotlib.pyplot as plt
import numpy as np

from earthsciencekit.climate import outgoing_longwave
from earthsciencekit.units import convert

cool, hot = convert(np.array([525.0, 1200.0]), "degC", "K")
ratio = outgoing_longwave(hot, 1) / outgoing_longwave(cool, 1)
assert np.isclose(ratio, 11.6, atol=0.05)
temperature = np.geomspace(150, 2000, 200)
flux = outgoing_longwave(temperature, 1)
np.testing.assert_allclose(np.gradient(np.log(flux), np.log(temperature)), 4)

fig, ax = plt.subplots()
ax.loglog(temperature, flux, label="blackbody, slope 4")
ax.loglog([cool, hot], outgoing_longwave(np.array([cool, hot]), 1), "o", label=f"Tyndall's wire, ratio {ratio:.1f}")
ax.loglog(255, outgoing_longwave(255, 1), "s", label="Earth's emission")
ax.set(xlabel="temperature [K]", ylabel="emitted flux [W/m²]", title="Emission grows as the fourth power of temperature")
ax.legend()

plt.show()
Total running time of the script: (0 minutes 0.189 seconds)
