Note
Go to the end to download the full example code or to run this example in your browser via JupyterLite.
Urey’s isotope paleothermometer (1947)#
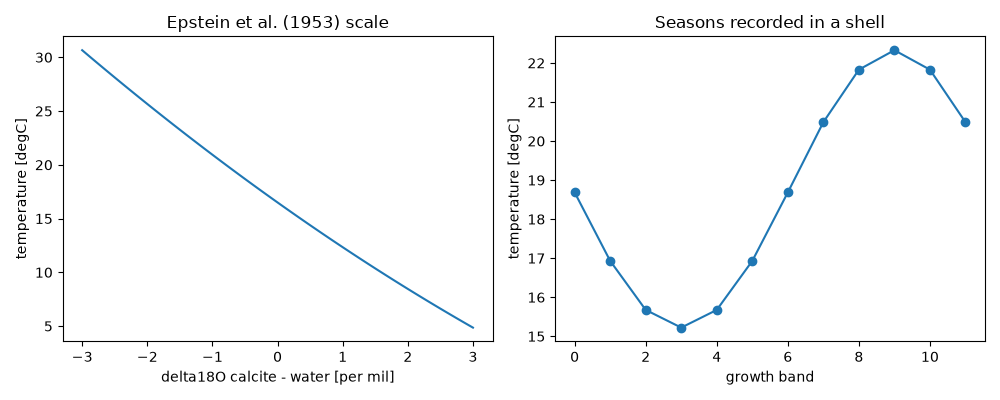
Harold Urey calculated that the oxygen-18 content of calcite precipitated from water depends on temperature, and proposed reading ancient ocean temperatures from fossil shells. Epstein, Buchsbaum, Lowenstam and Urey calibrated the scale in 1953: about 4 K of cooling per per mil of enrichment. The synthetic shell record below converts delta values into temperatures.
import matplotlib.pyplot as plt
import numpy as np

from earthsciencekit.units import convert
from earthsciencekit.volcanology import isotope_temperature

difference = np.linspace(-3, 3, 121)
temperature = convert(isotope_temperature(difference, 0), "K", "degC")
assert np.all(np.diff(temperature) < 0)
assert np.isclose(temperature[60], 16.5) and 3.8 < temperature[40] - temperature[60] < 4.6

layer = np.arange(12)
shells = -0.5 + 0.8 * np.sin(2 * np.pi * layer / 12)  # synthetic seasonal delta18O, water at 0 per mil
fig, (left, right) = plt.subplots(1, 2, figsize=(10, 4))
left.plot(difference, temperature)
left.set(xlabel="delta18O calcite - water [per mil]", ylabel="temperature [degC]", title="Epstein et al. (1953) scale")
right.plot(layer, convert(isotope_temperature(shells, 0), "K", "degC"), "o-")
right.set(xlabel="growth band", ylabel="temperature [degC]", title="Seasons recorded in a shell")
fig.tight_layout()

plt.show()
Total running time of the script: (0 minutes 0.180 seconds)
