Note
Go to the end to download the full example code or to run this example in your browser via JupyterLite.
Dupuit’s unconfined flow (1863)#
Jules Dupuit assumed that groundwater beneath a gently sloping water table moves horizontally with a velocity uniform on each vertical, driven by the slope of the water table. Darcy’s law then gives a discharge proportional to the thickness times the slope, which is constant between two rivers, so the square of the water-table height varies linearly and the profile is a parabola. The example draws the profile and checks that every section carries the same discharge.
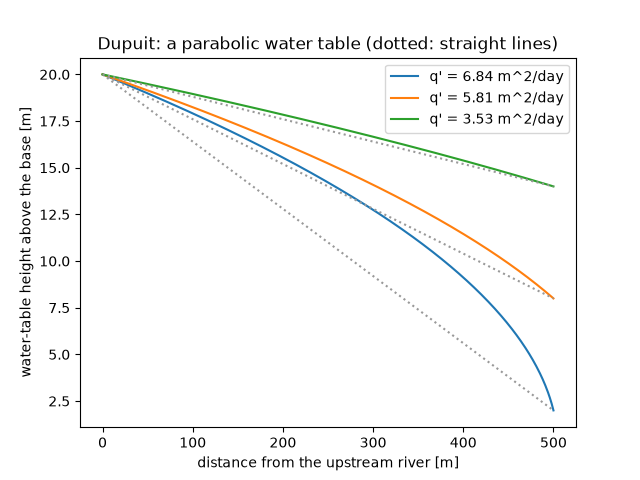
import matplotlib.pyplot as plt
import numpy as np

from earthsciencekit.hydrology import darcy_flux, dupuit_discharge, dupuit_head

length, conductivity = 500.0, 2e-4
x = np.linspace(0, length, 501)
fig, ax = plt.subplots()
for downstream in (2.0, 8.0, 14.0):
    head = dupuit_head(x, 20, downstream, length)
    section = darcy_flux(conductivity, np.gradient(head**2, x)) / 2  # h dh/dx = d(h^2)/dx / 2
    discharge = dupuit_discharge(conductivity, 20, downstream, length)
    assert np.allclose(section[1:-1], discharge, rtol=1e-9)
    ax.plot(x, head, label=f"q' = {discharge * 86400:.2f} m^2/day")
    ax.plot(x, 20 + (downstream - 20) * x / length, ":", color="0.6")
ax.set(xlabel="distance from the upstream river [m]", ylabel="water-table height above the base [m]")
ax.set_title("Dupuit: a parabolic water table (dotted: straight lines)")
ax.legend()

plt.show()
Total running time of the script: (0 minutes 0.101 seconds)
