Note
Go to the end to download the full example code or to run this example in your browser via JupyterLite.
Thermal expansion and ice melt in the sea-level budget (2005)#
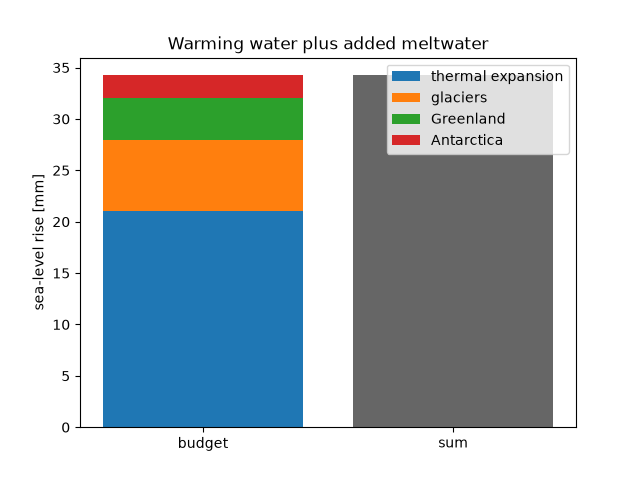
By 2005, ocean temperature profiles going back to the 1950s gave the first global estimates of thermosteric sea-level rise. Antonov, Levitus and Boyer found about 0.33 mm per year from warming of the upper 700 m over 1955-2003. With satellite altimetry and glacier mass balance, this made it possible to close the budget: the observed rise should be the sum of warming water and added meltwater. About 362 Gt of water raises the global ocean by 1 mm. The numbers below are illustrative.
import matplotlib.pyplot as plt
import numpy as np

from earthsciencekit.climate import thermal_expansion_sea_level, water_equivalent_sea_level

ocean_area, density = 3.62e14, 1000.0
assert np.isclose(water_equivalent_sea_level(362e12, ocean_area, density), 1e-3)
components = {
    "thermal expansion": thermal_expansion_sea_level(1.5e-4, 700, 0.2),
    "glaciers": water_equivalent_sea_level(2.5e15, ocean_area, density),
    "Greenland": water_equivalent_sea_level(1.5e15, ocean_area, density),
    "Antarctica": water_equivalent_sea_level(0.8e15, ocean_area, density),
}
total = sum(components.values())
assert np.isclose(total, 0.021 + 4.8e15 / (ocean_area * density))

fig, ax = plt.subplots()
bottom = 0.0
for name, value in components.items():
    ax.bar("budget", value * 1e3, bottom=bottom * 1e3, label=name)
    bottom += value
ax.bar("sum", total * 1e3, color="0.4")
ax.set(ylabel="sea-level rise [mm]", title="Warming water plus added meltwater")
ax.legend()

plt.show()
Total running time of the script: (0 minutes 0.076 seconds)
