Note
Go to the end to download the full example code or to run this example in your browser via JupyterLite.
Dalton’s evaporation law (1802)#
John Dalton measured the water lost from heated vessels and found that the rate of evaporation is proportional to the difference between the vapour pressure at the temperature of the water and the vapour pressure already in the air, and grows with the wind. Evaporation stops when the air is saturated and turns into condensation when the air holds more vapour than the surface.
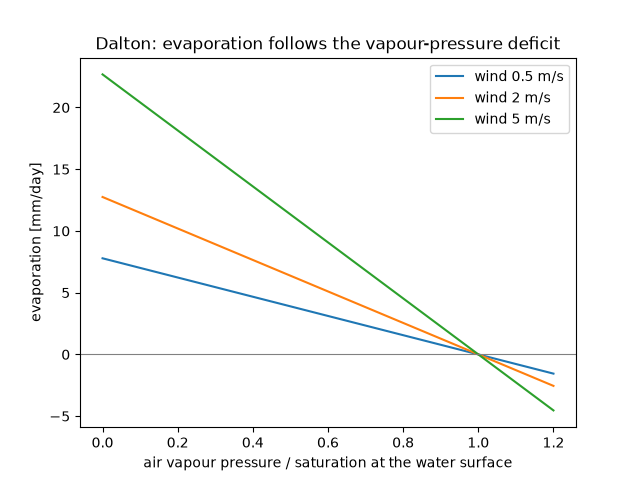
import matplotlib.pyplot as plt
import numpy as np

from earthsciencekit.atmosphere import saturation_vapor_pressure
from earthsciencekit.hydrology import dalton_evaporation

surface = saturation_vapor_pressure(293.15)  # water at 20 degC
air = np.linspace(0, 1.2 * surface, 100)
fig, ax = plt.subplots()
for wind in (0.5, 2.0, 5.0):
    coefficient = 3.0e-8 * (1 + 0.54 * wind)  # kg/(m^2 s Pa), 0.26 (1 + 0.54 u) mm/day per hPa
    rate = dalton_evaporation(surface, air, coefficient) * 86400  # mm/day
    ax.plot(air / surface, rate, label=f"wind {wind:g} m/s")
assert dalton_evaporation(surface, surface, 1e-9) == 0 and dalton_evaporation(surface, 1.1 * surface, 1e-9) < 0
ax.axhline(0, color="0.5", lw=0.8)
ax.set(xlabel="air vapour pressure / saturation at the water surface", ylabel="evaporation [mm/day]")
ax.set_title("Dalton: evaporation follows the vapour-pressure deficit")
ax.legend()

plt.show()
Total running time of the script: (0 minutes 0.092 seconds)
