Note
Go to the end to download the full example code or to run this example in your browser via JupyterLite.
McCarthy’s Muskingum routing (1938)#
Gerald McCarthy, working on flood control in the Muskingum basin of Ohio,
wrote the storage of a river reach as a weighted mix of its inflow and
outflow, S = K (X I + (1 - X) O). Combined with continuity, the outflow
becomes a fixed linear combination of the latest inflows and the previous
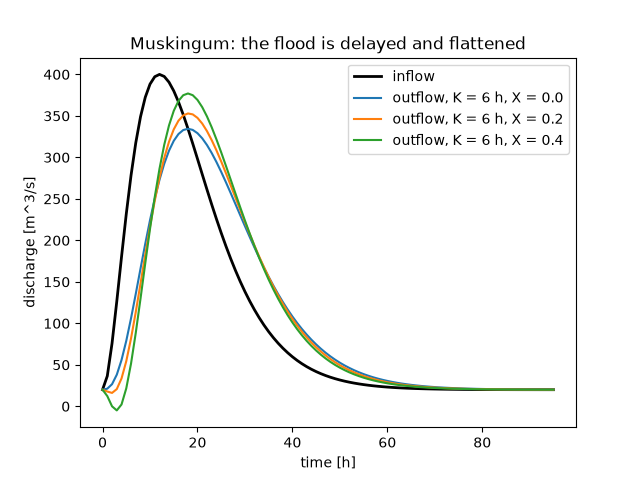
outflow. Routing a flood through a reach delays it by about K and lowers
its peak, more so when X is small, while conserving its volume.
import matplotlib.pyplot as plt
import numpy as np

from earthsciencekit.hydrology import muskingum_coefficients, muskingum_routing

step = 3600.0
hours = np.arange(96)
inflow = 20 + 380 * (hours / 12) ** 2 * np.exp(2 * (1 - hours / 12))  # m^3/s
fig, ax = plt.subplots()
ax.plot(hours, inflow, "k", lw=2, label="inflow")
for weighting in (0.0, 0.2, 0.4):
    assert np.isclose(muskingum_coefficients(6 * step, weighting, step).sum(), 1)
    outflow = muskingum_routing(inflow, 6 * step, weighting, step)
    assert np.isclose(outflow.sum(), inflow.sum(), rtol=1e-3) and outflow.max() < inflow.max()
    ax.plot(hours, outflow, label=f"outflow, K = 6 h, X = {weighting}")
ax.set(xlabel="time [h]", ylabel="discharge [m^3/s]", title="Muskingum: the flood is delayed and flattened")
ax.legend()

plt.show()
Total running time of the script: (0 minutes 0.101 seconds)
