

Note
Go to the end to download the full example code.
The Isolation of Graphene: Flakes, Edges, and a Berry Phase of pi#
When Novoselov, Geim and coworkers isolated graphene in 2004, the tight-binding picture was ready: two Dirac cones, at the inequivalent corners \(K\) and \(K'\) of the Brillouin zone. The experiments of 2005 (Novoselov et al.; Zhang, Tan, Stormer and Kim) confirmed its most striking prediction through the anomalous quantum Hall effect: the Bloch states carry a sublattice pseudospin that winds once around each Dirac point – in opposite senses at the two valleys – so an electron circling either one picks up a Berry phase of \(\pi\).
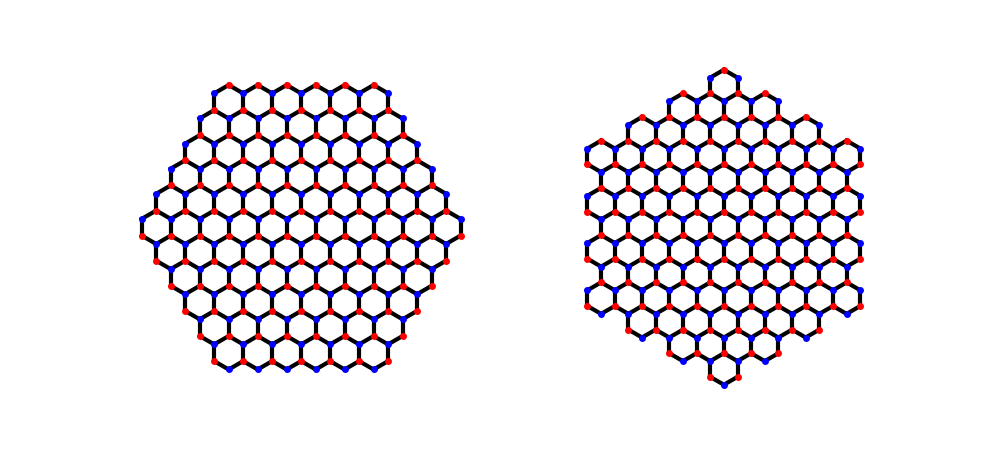
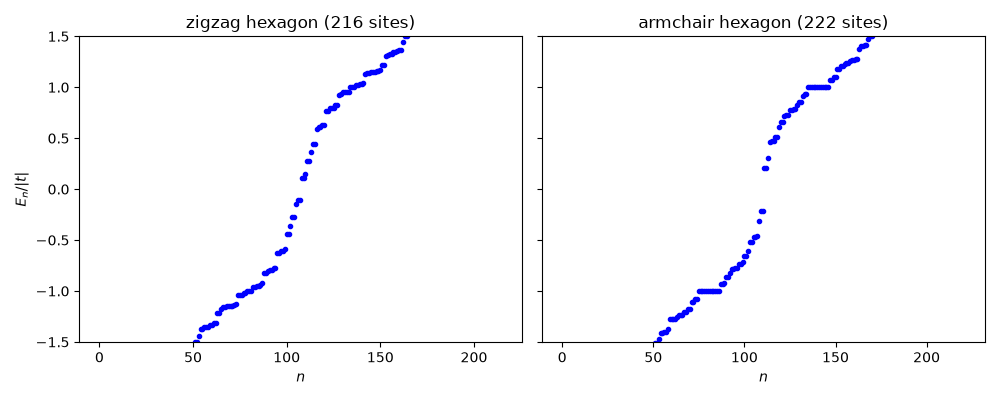
A real flake also has edges, and they matter. Zigzag edges carry states at zero energy: a triangle, whose three zigzag edges all end on the same sublattice, has exactly \(||A| - |B||\) exact zero modes. On a hexagon the six zigzag edges alternate sublattices and their edge states hybridize, but their splitting shrinks faster than the confinement gap \(\propto 1/L\) of a hexagon with armchair edges, which carry no edge states at all.
import numpy as np
import matplotlib.pyplot as plt

import tbkit.lattices as lattices
from tbkit.graphene import GrapheneLattice
from tbkit.kspace import KSpace, reciprocal_vectors
from tbkit.plot import Plot
from tbkit.system import System

t = -1.
bloch = KSpace(lattices.honeycomb())
bloch.set_hopping([{'i': 0, 'j': 1, 'R': R, 't': t} for R in [(0, 0), (-1, 0), (0, -1)]])
b1, b2 = (np.array(v) for v in reciprocal_vectors(bloch.lat.prim_vec))
K = (b1 - b2) / 3
Two valleys: a Berry phase of pi, opposite pseudospin windings#
def berry_phase_around(k0, radius=0.05, n=200):
    '''Berry phase of the lower band along a small circle around k0.'''
    ks = [k0 + radius * np.array([np.cos(a), np.sin(a)]) for a in 2*np.pi*np.arange(n)/n]
    v = [np.linalg.eigh(bloch.get_ham(k))[1][:, 0] for k in ks]
    return -np.angle(np.prod([np.vdot(v[m], v[(m + 1) % n]) for m in range(n)]))


def winding_around(k0, radius=0.05, n=200):
    '''Winding of the pseudospin, the phase of H_AB(k), around k0.'''
    phase = [np.angle(bloch.get_ham(k0 + radius * np.array([np.cos(a), np.sin(a)]))[0, 1])
                  for a in 2*np.pi*np.arange(n + 1)/n]
    return np.sum((np.diff(phase) + np.pi) % (2*np.pi) - np.pi) / (2*np.pi)


for k0 in (K, -K):
    assert np.allclose(np.linalg.eigvalsh(bloch.get_ham(k0)), 0.)
    assert np.isclose(abs(berry_phase_around(k0)), np.pi, atol=1e-3)
w_k, w_kp = winding_around(K), winding_around(-K)
print("Berry phase pi around both valleys; pseudospin winding {:+.3f} at K, {:+.3f} at K'.".format(w_k, w_kp))
assert np.isclose(abs(w_k), 1.) and np.isclose(w_kp, -w_k)
Berry phase pi around both valleys; pseudospin winding -1.000 at K, +1.000 at K'.
Zigzag edges: zero modes; armchair edges: a gap#
def flake(shape, n):
    lat = GrapheneLattice()
    getattr(lat, shape)(n=n)
    sys = System(lat)
    sys.set_hopping([{'n': 1, 't': t}])
    sys.get_ham()
    sys.get_eig()
    return lat, sys


for n in (3, 5, 7):
    lat, sys = flake('triangle_zigzag', n)
    imbalance = abs(2 * int(np.sum(lat.coor['tag'] == 'a')) - lat.sites)
    zero_modes = int(np.sum(np.abs(sys.en) < 1e-8))
    print('zigzag triangle, {} sites: {} zero modes (||A| - |B|| = {}).'.format(lat.sites, zero_modes, imbalance))
    assert zero_modes == imbalance

# lowest level times size n: constant for a confinement gap (armchair),
# falling for hybridized edge states (zigzag)
scaled = {}
for shape, ns in (('hexagon_zigzag', (3, 6)), ('hexagon_armchair', (2, 5))):
    gaps = []
    for n in ns:
        lat, sys = flake(shape, n)
        gaps.append(n * np.min(np.abs(sys.en)))
    scaled[shape] = gaps[1] / gaps[0]
    print('{}: n x lowest |E| changes by a factor {:.2f} from n = {} to {}.'.format(shape, scaled[shape], *ns))
assert scaled['hexagon_armchair'] > 0.85 and scaled['hexagon_zigzag'] < 0.7

lat_zz, sys_zz = flake('hexagon_zigzag', 6)
lat_ac, sys_ac = flake('hexagon_armchair', 4)
print('Hexagons of {} (zigzag) and {} (armchair) sites: lowest |E| = {:.3f} and {:.3f}.'
          .format(lat_zz.sites, lat_ac.sites, np.min(np.abs(sys_zz.en)), np.min(np.abs(sys_ac.en))))
assert np.min(np.abs(sys_zz.en)) < 0.6 * np.min(np.abs(sys_ac.en))
zigzag triangle, 9 sites: 3 zero modes (||A| - |B|| = 3).
zigzag triangle, 25 sites: 5 zero modes (||A| - |B|| = 5).
zigzag triangle, 49 sites: 7 zero modes (||A| - |B|| = 7).
hexagon_zigzag: n x lowest |E| changes by a factor 0.63 from n = 3 to 6.
hexagon_armchair: n x lowest |E| changes by a factor 0.89 from n = 2 to 5.
Hexagons of 216 (zigzag) and 222 (armchair) sites: lowest |E| = 0.107 and 0.211.
The two hexagons: the same honeycomb lattice (sublattices ‘a’ and ‘b’ in two colours), cut along zigzag edges (left) and armchair edges (right).
<Figure size 1000x450 with 2 Axes>
Their spectra:
fig, axes = plt.subplots(1, 2, figsize=(10, 4), sharey=True)
for ax, sys, name in ((axes[0], sys_zz, 'zigzag hexagon'), (axes[1], sys_ac, 'armchair hexagon')):
    ax.plot(sys.en, 'ob', ms=3)
    ax.set_ylim(-1.5, 1.5)
    ax.set_title('{} ({} sites)'.format(name, sys.lat.sites))
    ax.set_xlabel('$n$')
axes[0].set_ylabel('$E_n/|t|$')
fig.set_layout_engine('tight')
Total running time of the script: (0 minutes 0.175 seconds)