

Note
Go to the end to download the full example code.
The Zak Phase: Where the SSH Chain’s Electrons Sit#
J. Zak showed in 1989 that the Berry phase acquired by a Bloch state carried once across the Brillouin zone,
is a property of the whole band – the Zak phase – and that \(\gamma/2\pi\) is the centre of the band’s Wannier functions in units of the lattice constant: the electronic polarization. With inversion symmetry it is quantized to 0 or \(\pi\).
In the SSH chain (sites at \(x = 0\) and \(x = 1/2\), intracell
hopping \(v\), intercell \(w\)), the occupied band’s Wannier
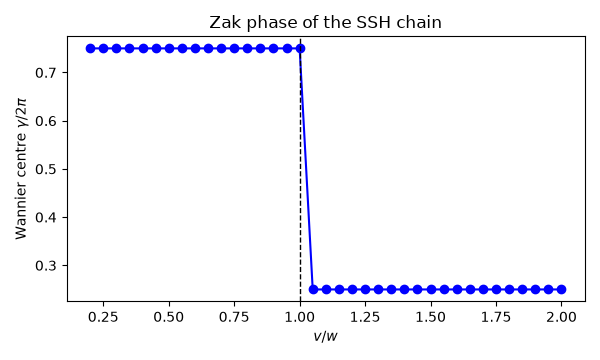
function sits on the stronger bond: at the intracell bond centre
\(x = 1/4\) when \(v > w\), at the intercell one \(x = 3/4\)
when \(w > v\). The two phases differ by \(\pi\) – half an
electron per cell moved by half a cell – and the jump is what leaves
the end charges and zero modes of an open topological chain.
berry_phase() and
wannier_centers() compute both, from the
gauge-invariant discrete Wilson loop.
import numpy as np
import matplotlib.pyplot as plt

from tbkit.lattice import Lattice
from tbkit.bridges import finite_system
from tbkit.kspace import KSpace
from tbkit.plot import Plot


def ssh(v, w):
    lat = Lattice(unit_cell=[{'tag': 'a', 'r0': (0., 0.)}, {'tag': 'b', 'r0': (0.5, 0.)}],
                         prim_vec=[(1., 0.)])
    chain = KSpace(lat)
    chain.set_hopping([{'i': 0, 'j': 1, 'R': (0,), 't': v},
                                {'i': 1, 'j': 0, 'R': (1,), 't': w}])
    return chain
The lattice#
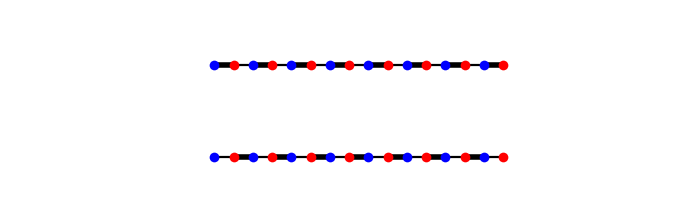
Eight cells of the SSH chain (finite_system()),
orbitals a and b in two colours, bond widths proportional to the
hoppings: \(v\) inside each cell, \(w\) between cells, for
\(v > w\) (top) and \(v < w\) (bottom).
<Figure size 700x220 with 2 Axes>
The Wannier centre sits on the strong bond#
v = 1.0, w = 0.4: Wannier centre x = 0.250000
v = 0.4, w = 1.0: Wannier centre x = 0.750000
Across the transition: a jump of pi#
The Zak phase is pinned while the gap stays open, and jumps by \(\pi\) where it closes, at \(v = w\).
ratios = np.linspace(0.2, 2., 37)
zak = np.array([ssh(r, 1.).berry_phase(0, nk=200) for r in ratios])
centres = (zak / (2*np.pi)) % 1.
topo = ratios < 1.
assert np.allclose(centres[topo], 0.75, atol=1e-8)
assert np.allclose(centres[~topo & ~np.isclose(ratios, 1.)], 0.25, atol=1e-8)
print('Wannier centre 3/4 for v < w, 1/4 for v > w: a jump of half a cell (Zak phase pi).')

fig, ax = plt.subplots(figsize=(6, 3.6))
ax.plot(ratios, centres, 'o-b')
ax.axvline(1., color='k', ls='--', lw=1)
ax.set_xlabel('$v/w$')
ax.set_ylabel(r'Wannier centre $\gamma/2\pi$')
ax.set_title('Zak phase of the SSH chain')
fig.set_layout_engine('tight')
Wannier centre 3/4 for v < w, 1/4 for v > w: a jump of half a cell (Zak phase pi).
The polarization is a property of the band, not of the gauge#
Placing both orbitals on the cell origin (positions=False) shifts
each phase, but not the quantized difference between the two phases.
Zak-phase difference in the periodic gauge: 3.141593 = pi.
Total running time of the script: (0 minutes 0.077 seconds)